In an analysis that could shift the narrative around the Bitcoin value proposition, crypto analyst TechDev has presented evidence suggesting that liquidity cycles, rather than the much-discussed Bitcoin halvings, are the primary catalyst for bull runs. Using a set of charts, TechDev offers a new perspective on Bitcoin’s price dynamics.
Is Bitcoin Halving Overrated?
In a recent post on X, TechDev asserts, “Still waiting on the halving? The ~3.5 year liquidity cycle has been running before Bitcoin existed.” The chart provided by TechDev illustrates a juxtaposition of Bitcoin’s price movements with a liquidity signal derived from major central bank balance sheets.
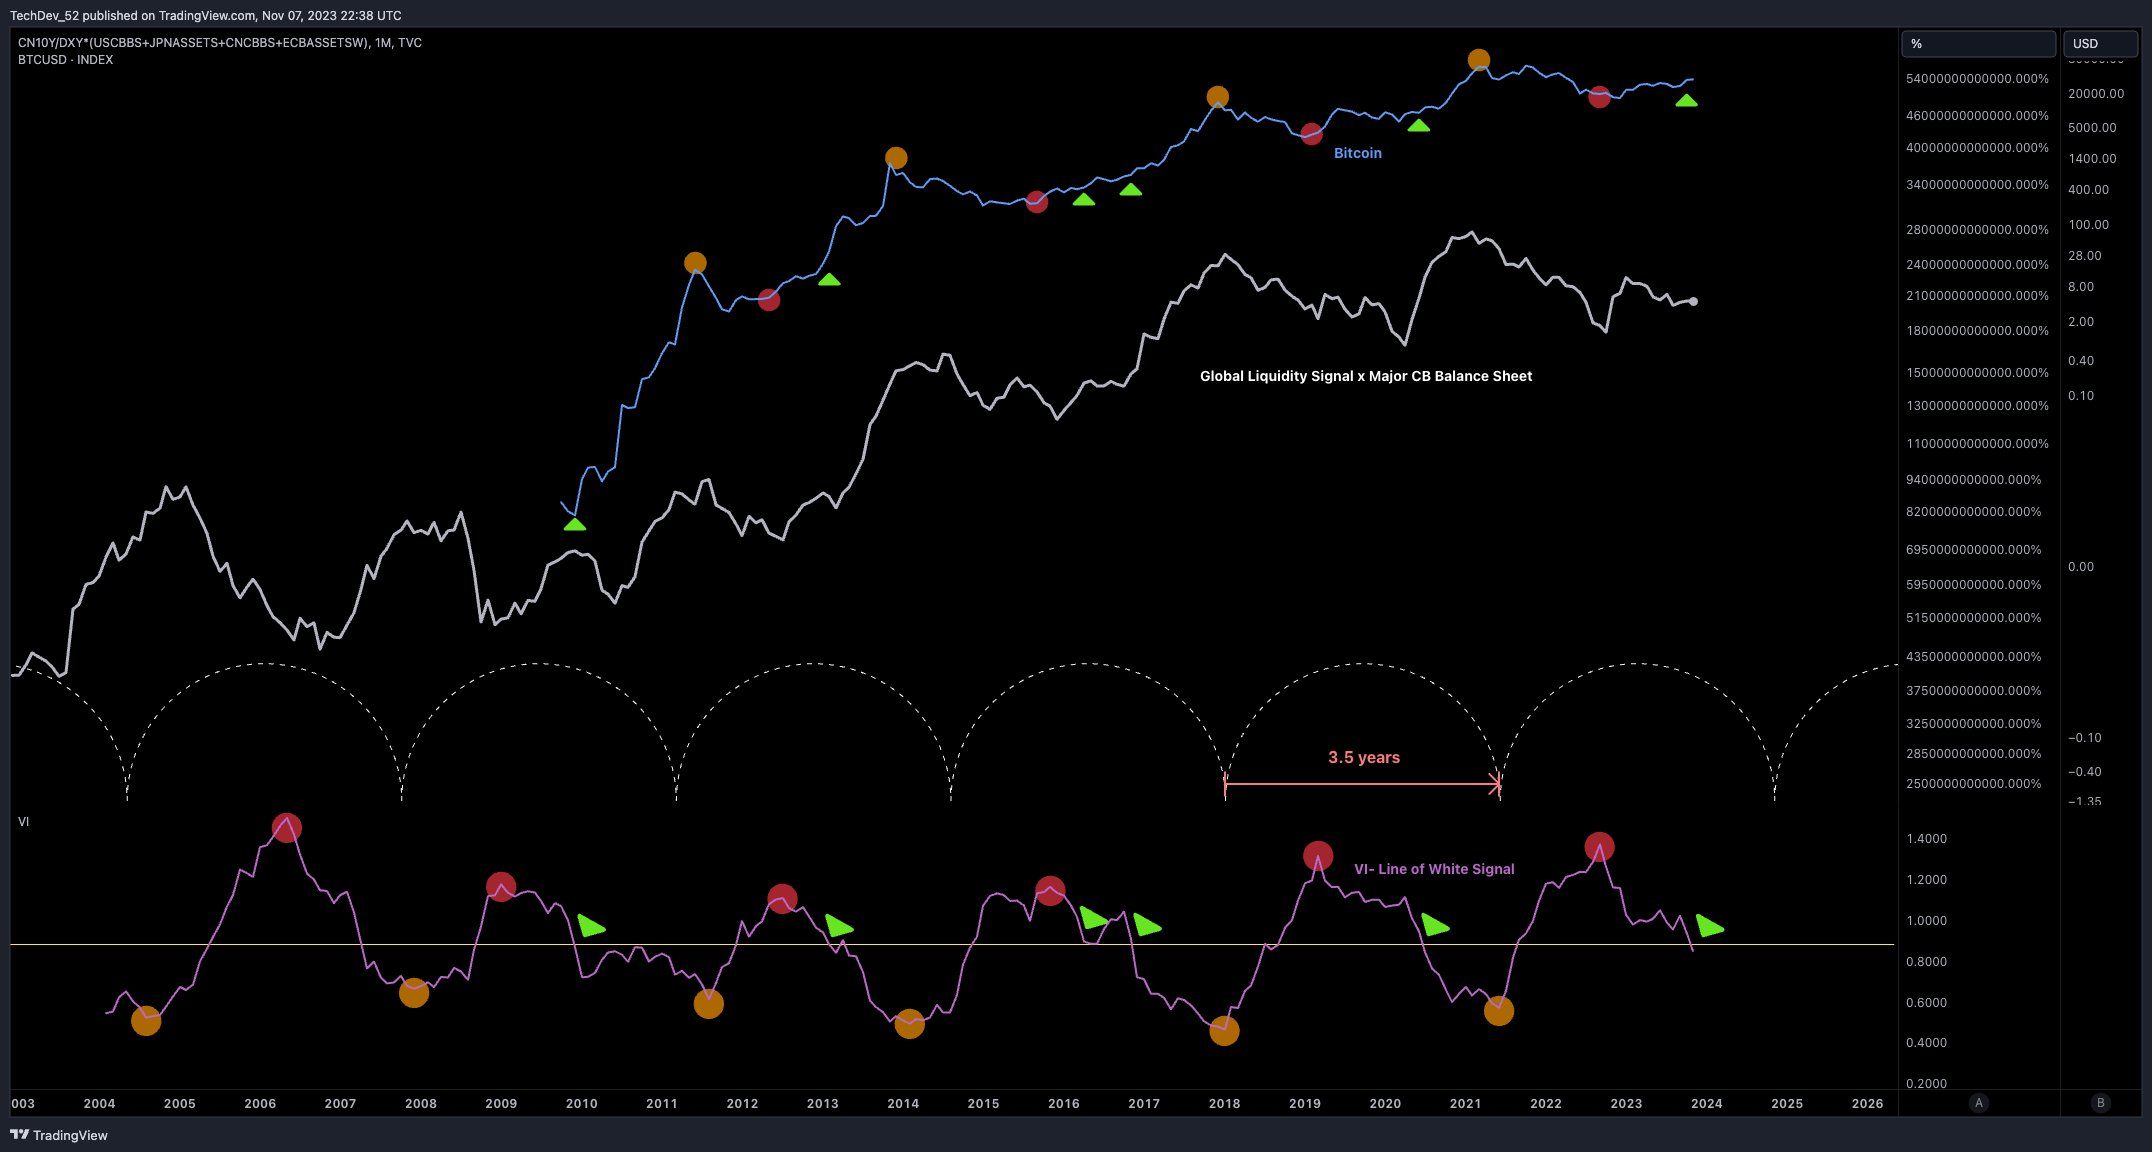
The striking feature in this chart is the series of sinusoidal lines that seem to predict pivot points in Bitcoin’s price trajectory. These pivot points, marked by colored dots, align closely with the inflections in the central banks’ aggregated balance sheet, suggesting a correlation between global liquidity and Bitcoin price movements.
It is worth noting that each liquidity cycle has a length of around 3.5 years, which is slightly shorter than the Bitcoin halving cycle, which takes place around every 4 years. Remarkably, the Vortex Indicator (VI), a technical indicator that is designed to identify the start of a new trend or the continuation of an existing trend, also aligns with this trend.
This correlation seems to hint at a broader economic tapestry at play, with the chart showing an intriguing synchronization with the expansion and contraction of major central bank balance sheets, denoted as the global liquidity signal.
Next Bitcoin Cycle High In 4-11 Months?
The second chart by Tech Dev further reinforces this relationship. It overlays the VI with the CN10Y/DXY. The VI here underscores the trend direction and strength, with turning points that coincide with the other indicators and Bitcoin’s price movements.
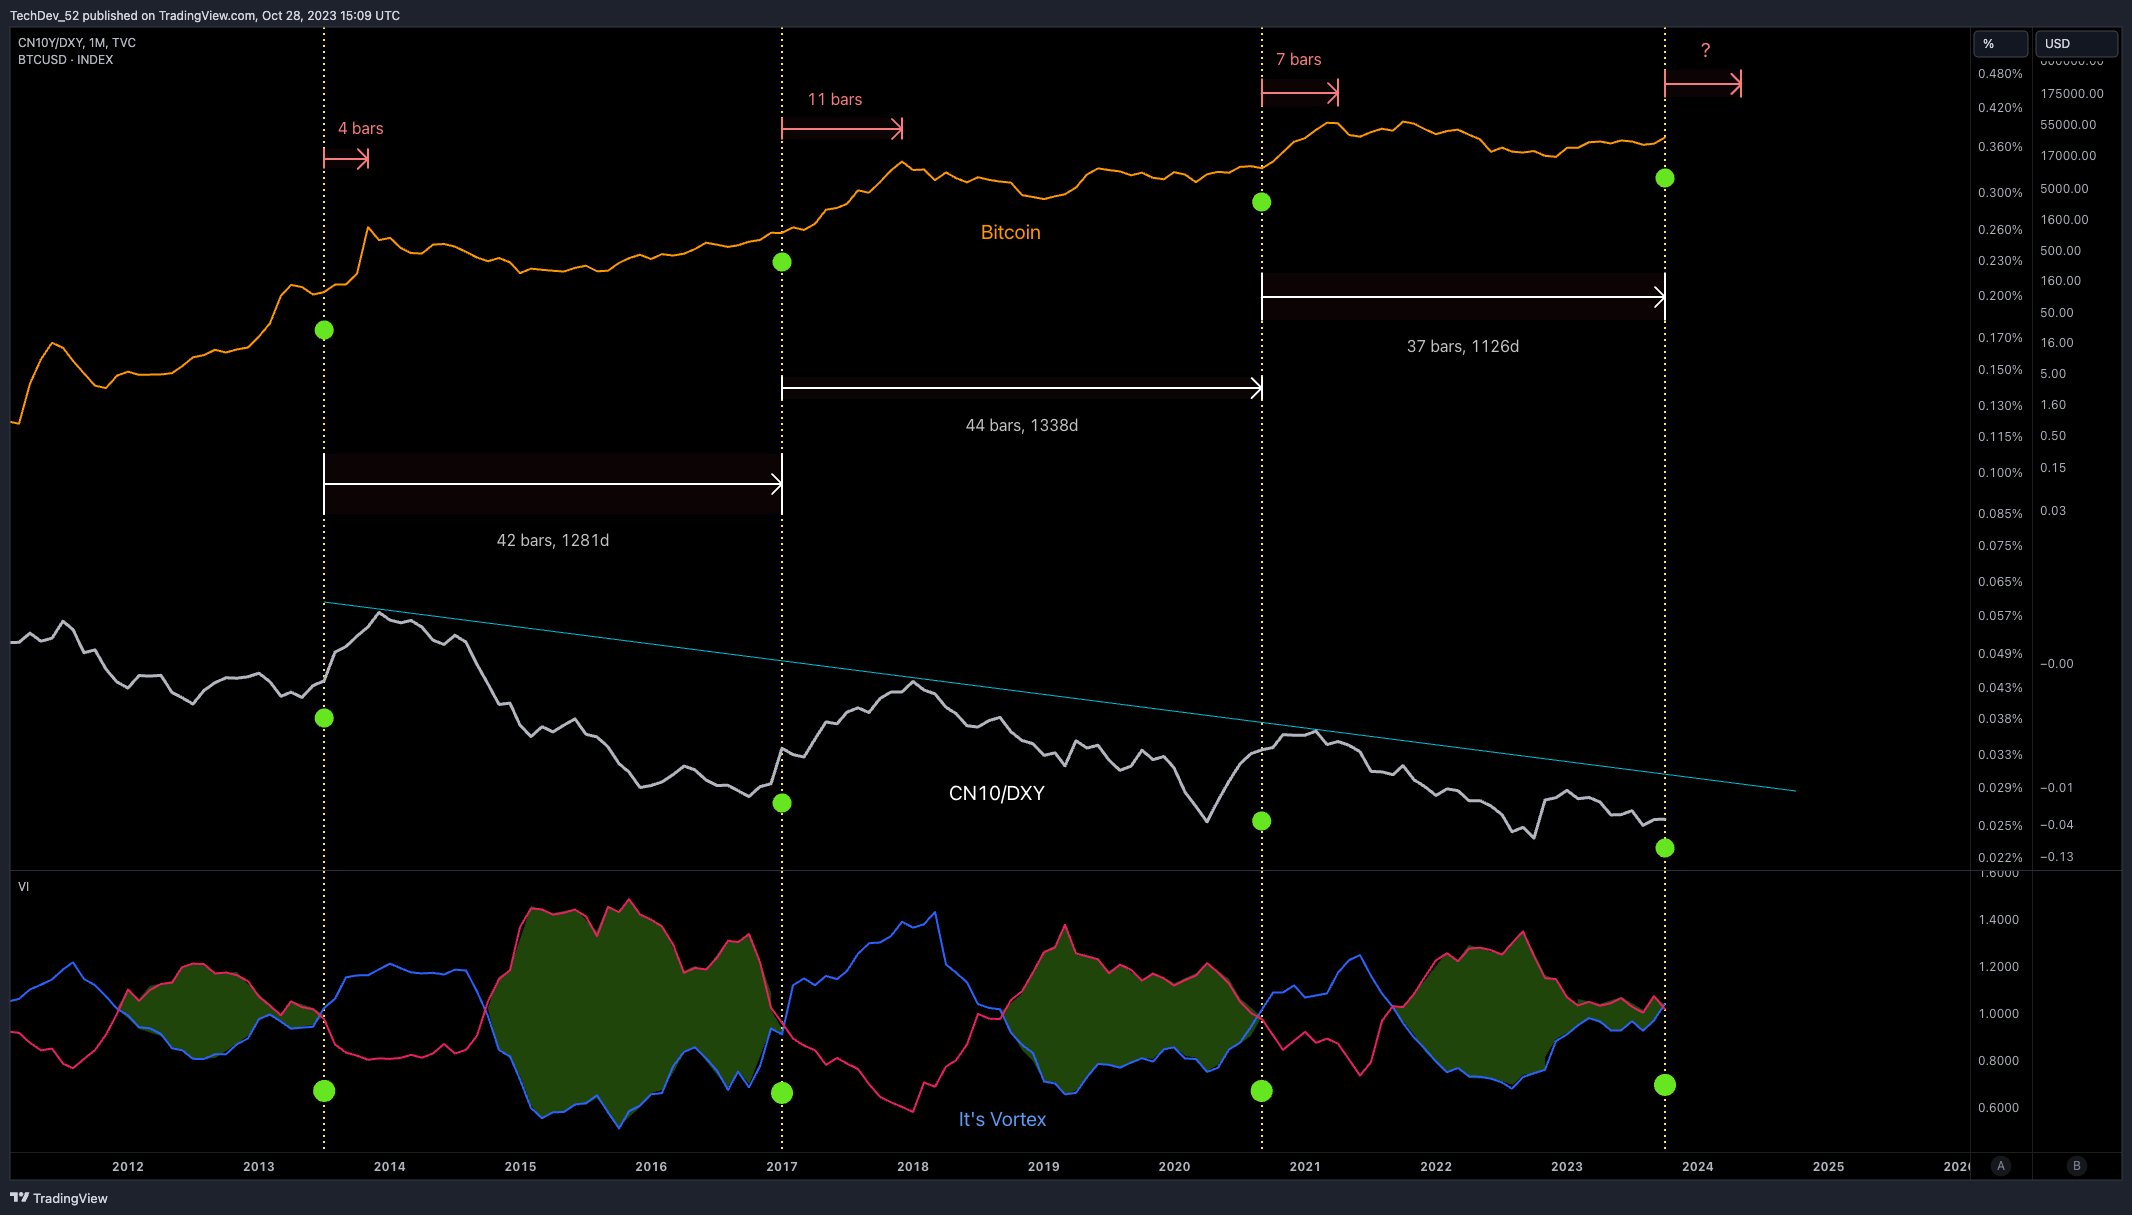
The yellow arrows (dotted lines) show when the positive vortex (blue line) crosses the negative vortex (red line), marking the start of a strong upward price move. Currently, another cross can be observed. During the last cycles, it took 4, 11, and 7 months after the signal for the BTC price to reach its cycle high.
The chart also points to the trend shifts in the CN10Y/DXY High-Yield Spread, which align with the VI and signal key moments in Bitcoin’s price trajectory. Notably, these moments do not align with halving events. TechDev claims that the liquidity cycles are the real drivers behind BTC’s explosive moves.
The previous liquidity cycle ran from December 2017 to mid-2021 and lasted 42 months. The cycle before that lasted from mid-2013 to the end of 2017 and was 44 months long. Currently, the liquidity cycle has been running for 37 months.
Elaborating on this, TechDev explains, “Doesn’t look like it’s ever been the halving. Clever if Satoshi tried to line it up though. It’s a liquidity cycle world. Bitcoin lives in it.” Following the question of an X user if the BTC price will top around February to March next year, he added, “Indeed possible. Would be fitting to top around the halving.”
Kristoph Jeffers, a partner at Three Jay Partners, echoed TechDev’s sentiments, acknowledging the visual effectiveness of these charts in understanding the market dynamics. Jeffers remarked, “Been talking about this for a while, and this is a great visualization of the dynamics at play. While the Bitcoin issuance rate is important, the liquidity cycle is the true driving force.”
In addition, the analyst has received a lot of encouragement from the BTC community and the technical analyst camp. Gern van Lagen commented, “Great one.” Bitcoin advocate Dr. Jeff Ross answered, “Great chart.”
Mike Alfred stated, “If I hear ‘I’m waiting for the halving’ one more damn time, I’m going to die laughing. Such an asinine approach but a lot of kids on this website are repeating it over and over like it’s gospel.”
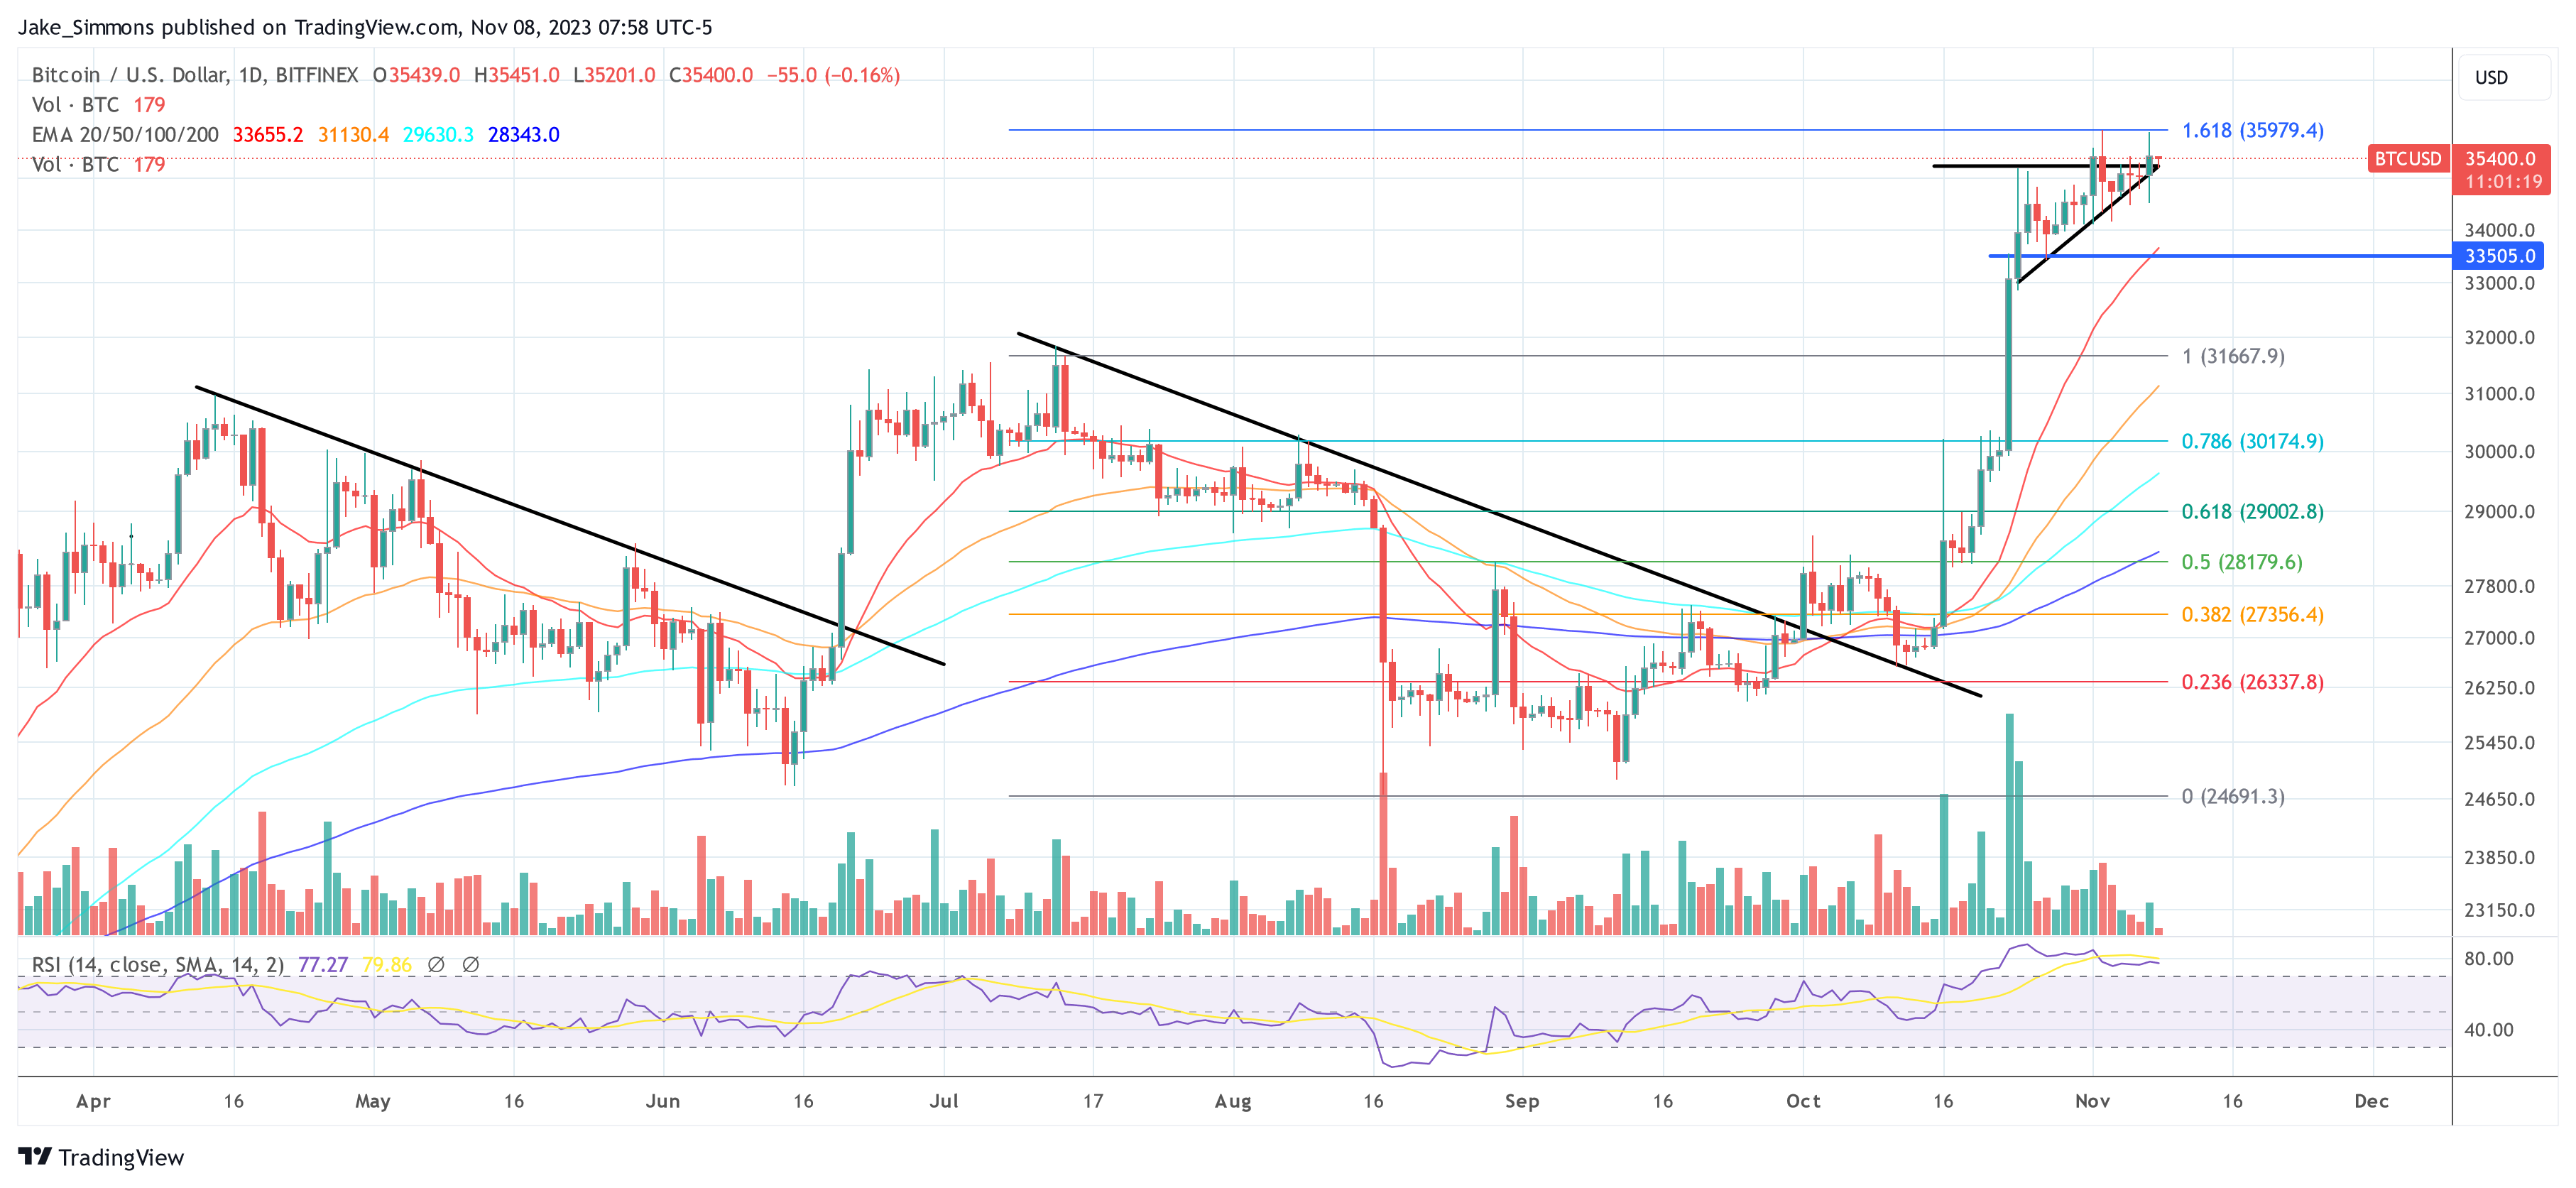
At press time, BTC traded at $35,400.

You can get bonuses upto $100 FREE BONUS when you:
💰 Install these recommended apps:
💲 SocialGood - 100% Crypto Back on Everyday Shopping
💲 xPortal - The DeFi For The Next Billion
💲 CryptoTab Browser - Lightweight, fast, and ready to mine!
💰 Register on these recommended exchanges:
🟡 Binance🟡 Bitfinex🟡 Bitmart🟡 Bittrex🟡 Bitget
🟡 CoinEx🟡 Crypto.com🟡 Gate.io🟡 Huobi🟡 Kucoin.


Comments