On-chain data shows Bitcoin long-term holder capitulation has deepened recently, but has not entered into the historical bottom zone yet.
Bitcoin Long-Term Holder SOPR Continues To Observe Deep Values Below ‘1’
As explained by an analyst in a CryptoQuant post, BTC long-term holders have been realizing losses in recent weeks.
The “spent output profit ratio” (or SOPR in short) is an indicator that tells us whether Bitcoin investors are currently selling at a profit or at a loss.
The metric works by checking the on-chain history of each coin being sold to see what price it was last moved at. If this last selling value of any coin was less than the current BTC price, then that coin has now been sold at a profit.
Related Reading | Can This Bitcoin Ratio Have Hints For A Bottom?
On the other hand, the previous price being more than the one right now would imply the coin has realized some loss.
When the SOPR is greater than one, it means the overall Bitcoin market is harvesting some profits at the moment. On the contrary, a value less than that implies loss realization is going on among BTC investors right now.
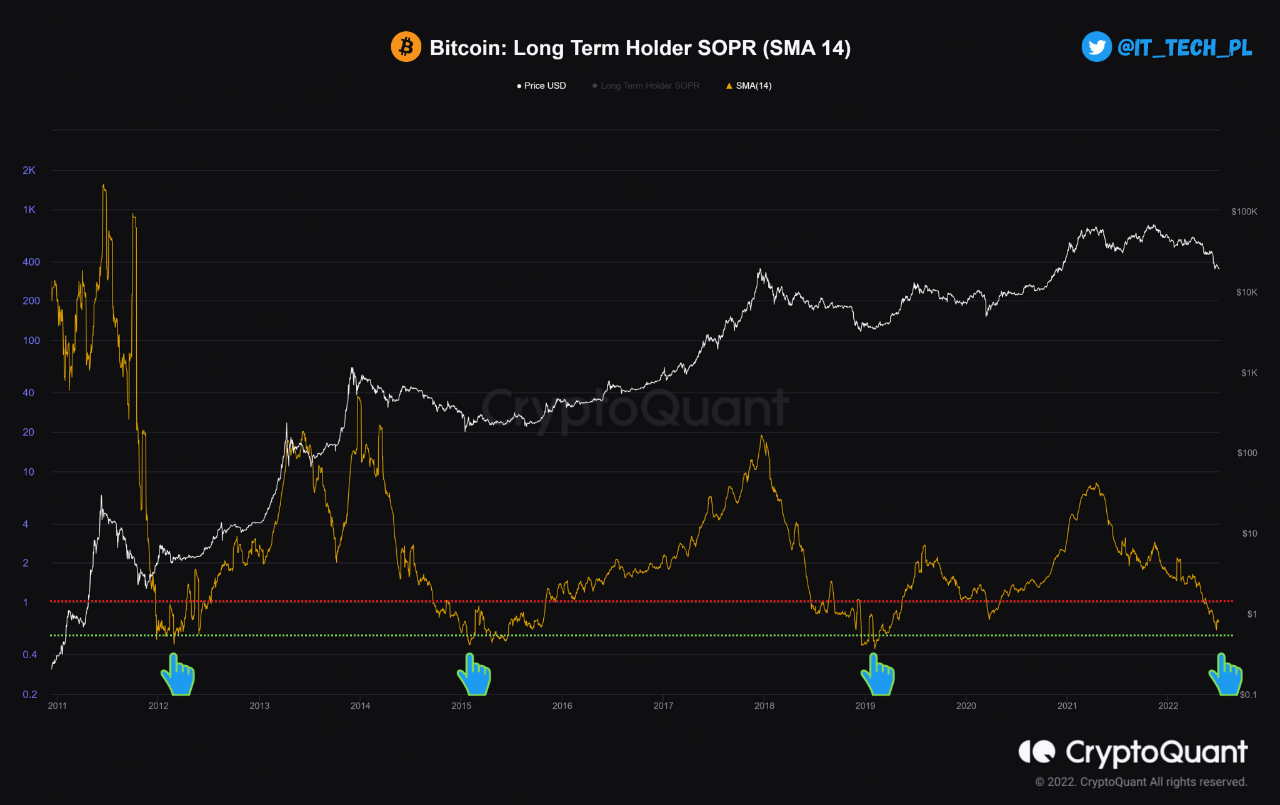
“Long-term holder” group includes all BTC investors that held their coins for at least 155 days before selling or moving them. The below chart shows the trend in the 14-day MA SOPR specifically for these LTHs:

The value of the metric seems to have been going down recently | Source: CryptoQuant
As you can see in the above graph, the quant has marked all the relevant points of trend for the 14-day MA Bitcoin long-term holder SOPR.
It seems like the major bottoms in the history of the crypto were formed whenever the indicator’s value sank to a value of around 0.48 (denoted by the green line in the chart).
Related Reading | $15k Possible Bottom For Bitcoin? “Delta Cap” Says So
This kind of value occurs when LTHs go into deep capitulation. Since this is the BTC cohort least likely to sell at any point, large loss realization from them can signal that the bear bottom is coming near.
Currently, the indicator is also below 1, but it still has a value of about 0.62, a bit higher than the historical bottom zone. This would suggest that while Bitcoin may be heading towards a bottom, it’s not quite there yet.
BTC Price
At the time of writing, Bitcoin’s price floats around $19.4k, down 9% in the past week. The below chart shows the trend in the value of the crypto over the last five days.

Looks like the price of the coin has been moving sideways over the last few days | Source: BTCUSD on TradingView
Featured image from Brent Jones on Unsplash.com, charts from TradingView.com, CryptoQuant.com

You can get bonuses upto $100 FREE BONUS when you:
💰 Install these recommended apps:
💲 SocialGood - 100% Crypto Back on Everyday Shopping
💲 xPortal - The DeFi For The Next Billion
💲 CryptoTab Browser - Lightweight, fast, and ready to mine!
💰 Register on these recommended exchanges:
🟡 Binance🟡 Bitfinex🟡 Bitmart🟡 Bittrex🟡 Bitget
🟡 CoinEx🟡 Crypto.com🟡 Gate.io🟡 Huobi🟡 Kucoin.


Comments