On-chain data shows the 7-day average Bitcoin mining hashrate has just witnessed its largest plunge since the China ban back in 2021.
Bitcoin Mining Hashrate Has Just Observed The Sharpest Drop In 3 Years
The “mining hashrate” refers to a measure of the total amount of computing power that the miners have connected to the Bitcoin network. This indicator may be used as a direct representation of the situation of the BTC miners.
When this metric’s value increases, the old miners expand, and new ones join in. Such a trend implies that these chain validators find the chain attractive.
On the other hand, a decline in the indicator suggests that some miners have decided to disconnect from the network, potentially because they are finding BTC mining unprofitable.
Now, here is a chart that shows the trend in the 7-day average Bitcoin mining hashrate over the past year:

As displayed in the above graph, the 7-day average Bitcoin mining hashrate had set a new all-time high (ATH) on the 27th of May, but since then, the metric has gone through a steep decline.
At the ATH, the indicator had a value of around 657.2 terahashes per second (TH/s), but now it has fallen to 566.8 TH/s, which corresponds to a plunge of almost 14%.
Back in April, the Bitcoin network witnessed its fourth Halving event. Halvings are periodic events occurring approximately every four years that permanently slash the asset’s block rewards in half.
The block rewards, which the miners receive as compensation for adding the next block to the network, serve as the majority of revenue for this cohort, so Halvings can significantly damage their finances.
As would be expected, the Hashrate declined following the latest Halving, as miners who were already under stress went underwater. However, the drawdown didn’t last too long, as after bottoming out in mid-May, the metric found a reversal to a strong upside.
Some thought that this rise to a new ATH signaled that the miner capitulation induced by the Halving had ended. The latest crash would suggest that this increase may have just been a temporary deviation, as the Hashrate is now back in line with its prior decline.
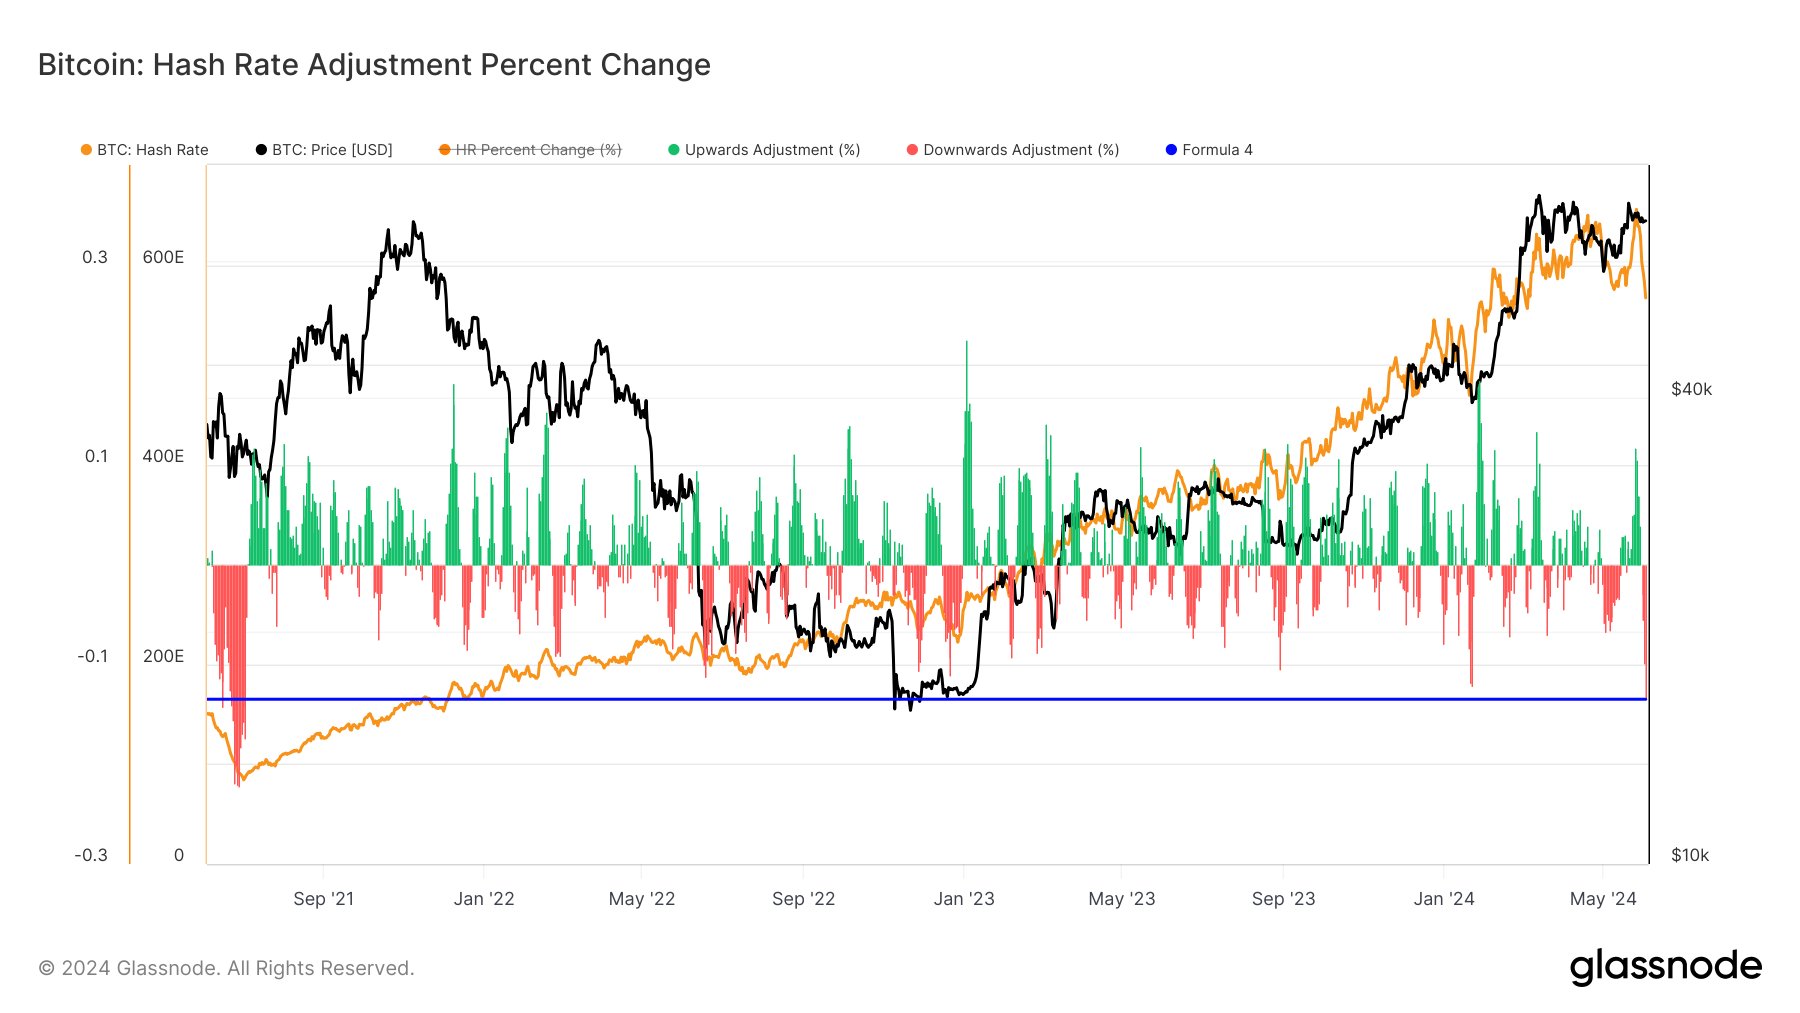
To put the plunge in the metric into perspective, analyst James Van Straten has posted a chart showing the percentage changes in the indicator over the past few years.
As is visible, this negative movement in the Bitcoin Hashrate is the largest since the one witnessed in mid-2021. This past crash, which was of an even larger scale, had occurred due to China’s ban on BTC mining in the country.
Back then, China held a significant share of the global Hashrate, so the ban took a large amount of BTC computing power offline. The metric didn’t recover until the miners could finish their relocation to other nations.
However, while that earlier crash was larger in scale than the recent drawdown, it’s hard to say if the current miner capitulation has even ended. The metric may continue to decline shortly and eventually surpass the scale of the Hashrate decline from 2021.
BTC Price
At the time of writing, Bitcoin is trading at around $69,800, up more than 3% over the past week.

You can get bonuses upto $100 FREE BONUS when you:
💰 Install these recommended apps:
💲 SocialGood - 100% Crypto Back on Everyday Shopping
💲 xPortal - The DeFi For The Next Billion
💲 CryptoTab Browser - Lightweight, fast, and ready to mine!
💰 Register on these recommended exchanges:
🟡 Binance🟡 Bitfinex🟡 Bitmart🟡 Bittrex🟡 Bitget
🟡 CoinEx🟡 Crypto.com🟡 Gate.io🟡 Huobi🟡 Kucoin.


Comments