Bitcoin has returned to the $20,000 area after experiencing rejection. The cryptocurrency has been displaying some strength during today’s trading session despite a spike in the U.S. dollar which signals danger for risk-on assets.
Related Reading | Cardano Releases New Update On Testnet, How Will The Price Respond?
At the time of writing, BTC’s price trades at $20,300 with a 2.2% profit in the last 24 hours. Data from Material Indicators (MI) records an increase in buying pressure from Bitcoin whales with bid orders of over $1 million (brown in the chart below).
Large investors have been accumulating BTC over the past week as the cryptocurrency moved below its current levels. BTC Whales could have been preparing for bullish continuation. At the time of writing, every investor’s class except retail is jumping into BTC’s price action.
#Bitcoin #WhaleWatching pic.twitter.com/BOYAEABpyC
— Material Indicators (@MI_Algos) July 5, 2022
The cryptocurrency needs to break above $20,500 and continue above $22,000 to clear out any potential short-term downside risk.
Material Indicators records over $20 million in asks order for BTC’s price at around $20,500 until $22,000 alone. There is little resistance above those levels until $24,000 which stands as the next major area of resistance.
On the possibility that large investors were accumulating BTC expecting a larger move to the upside, MI wrote:
The FireCharts heat map and CVD both show that the purple class of whales which have historically had the most influence over BTC price have been trending up since the dump to $17.5k on May 18th. Too early to validate this as accumulation phase. Time will tell.
The key behind the current price action could be the U.S. dollar. The currency aggressively moved to the upside, to levels last seen in 2003, and could be about to retest previous lows.
As seen below, this could send the DXY Index to the 105 area or to its June range below 100, if these levels fail. Thus, providing some more room for BTC’s price to reclaim higher levels.
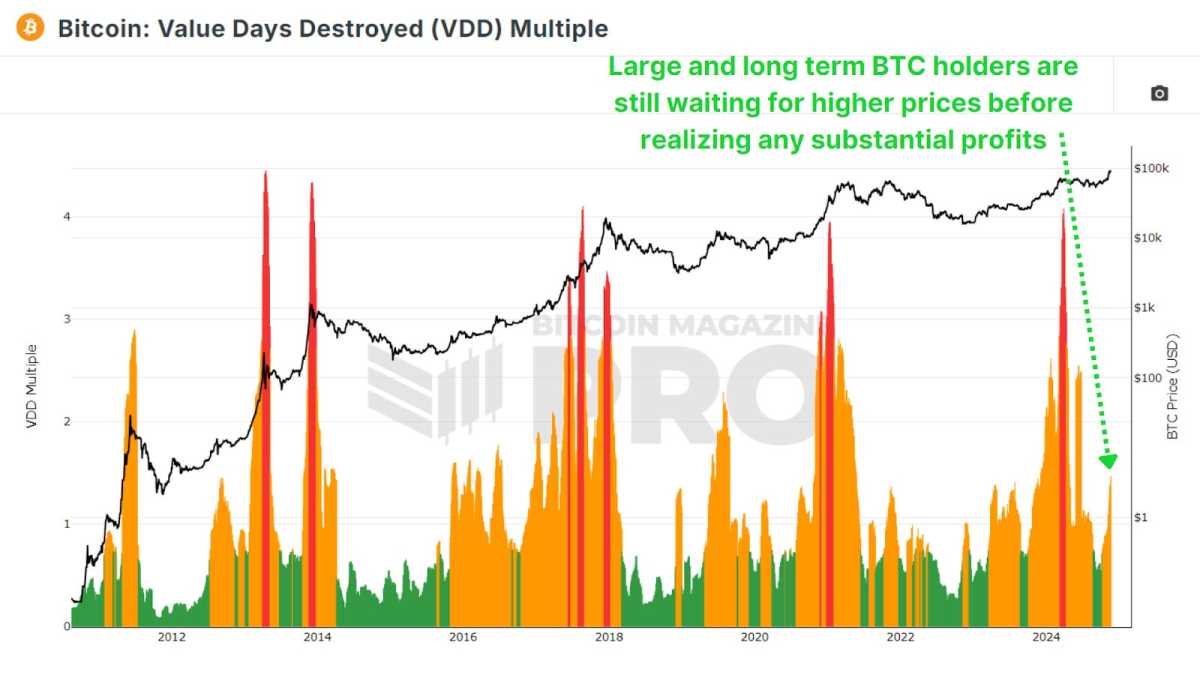
DXY Index (U.S. Dollar) sees some losses after a breakout on the daily chart. Source: Tradingview Bitcoin Indicators Suggest Bullish ContinuationQuantum Economics analyst Jan Wüstenfeld indicated that BTC’s Reserve Risk dropped to 0.001, a metric used to measure long-term holders’ conviction. The last time Bitcoin saw a Reserve Risk this low was in 2015 before it began a persistent uptrend.
Related Reading | Bitcoin (BTC) Claws Back To $20,000, First Time In 5 Days
Currently, there are macroeconomics factors that could hurdle BTC’s price reclaim of previous highs. However, the current area could be a major accumulation zone for the coming months and a good place to apply a Dollar Cost Average (DCA) strategy. Wüstenfeld said:
Bitcoin reserve risk has fallen below the green box. The last and only other time this happened was in August 2015. One thing is sure, this cycle is genuinely different to other cycles due to the macro conditions, and we are partially seeing that as well in the indicators.

You can get bonuses upto $100 FREE BONUS when you:
💰 Install these recommended apps:
💲 SocialGood - 100% Crypto Back on Everyday Shopping
💲 xPortal - The DeFi For The Next Billion
💲 CryptoTab Browser - Lightweight, fast, and ready to mine!
💰 Register on these recommended exchanges:
🟡 Binance🟡 Bitfinex🟡 Bitmart🟡 Bittrex🟡 Bitget
🟡 CoinEx🟡 Crypto.com🟡 Gate.io🟡 Huobi🟡 Kucoin.


Comments