A large pocket of Bitcoin supply is sitting just above the current market, and technical analysis shows that this area may decide the next major Bitcoin move.
On-chain analysis by crypto analyst Sherlockwhale identifies the $84,000 to $88,000 zone as arguably the largest supply cluster in Bitcoin’s current market structure, a region stacked with breakeven sellers and one where the short-term holder cost basis is sitting overhead.
Bitcoin Is Rallying Back Into A Heavy Supply Zone
Bitcoin’s recovery from its early February lows has been enough to generate different outlooks, but technical analysis of the weekly candlestick timeframe chart shows that the rally is now pressing into a stretch of the chart that many market participants have been waiting months to reach.
The analysis is based on what happened after Bitcoin lost the $84,000 region in January. According to the analyst, that breakdown pushed about 1.2 million BTC into an unrealized loss, meaning many holders who bought near that level were left trapped as the price moved lower.
Short-term holders, defined as investors who acquired their Bitcoin within the past 155 days, carry an average cost basis sitting between $86,900 and $88,000. That makes the current rally more complicated. If BTC were to continue this rally move back into the $84,000 to $88,000, it will give those trapped buyers a chance to exit near their entry price.
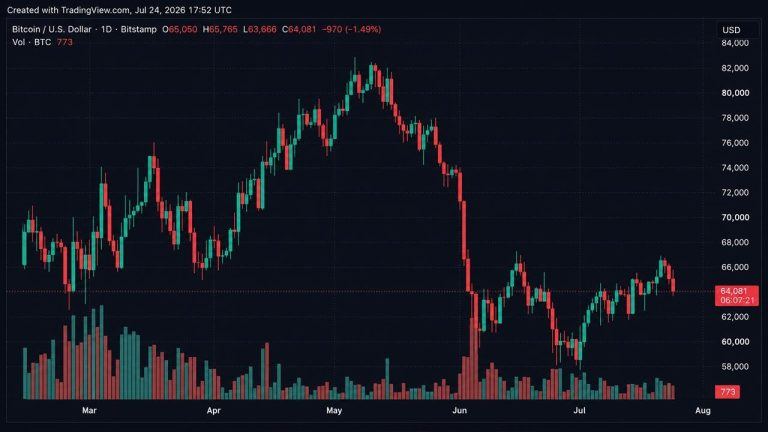
As shown in the chart below, the BTC price is currently trading at $80,662 on the weekly timeframe, just below a thick gray resistance band stretching roughly from $84,000 to $86,000. Above that is the short-term holder cost basis of around $86,900 to $88,000 that creates another layer of overhead pressure. Together, these levels form one of the biggest supply clusters on the chart.
What Technical Analysis Says About BTC’s Next Move
The technical analysis presents two possible paths for Bitcoin from the current price. The first path is a direct push into the $84,000 to $86,000 supply area, followed by a rejection and a pullback to support around $70,000. This would fit the analyst’s concern that Bitcoin is moving into an area where trapped buyers may sell into strength.
The second path is more volatile. Bitcoin could first dip from $80,000, reclaim momentum, push into the supply cluster, and then still face rejection near the short-term holder cost basis. In both cases, the chart suggests that $70,000 is the most important downside level if the rally fails at the overhead supply cluster resistance.
At the time of writing, Bitcoin is trading at $80,430, and buyers are still active. BTC briefly touched $82,000 in the past 24 hours amid optimism tied to CLARITY Act developments before pulling back below $81,000. A weekly close above $84,000 would weaken the case of an immediate rejection, but the larger confirmation would come from a clean move through $86,900 to $88,000.

You can get bonuses upto $100 FREE BONUS when you:
💰 Install these recommended apps:
💲 SocialGood - 100% Crypto Back on Everyday Shopping
💲 xPortal - The DeFi For The Next Billion
💲 CryptoTab Browser - Lightweight, fast, and ready to mine!
💰 Register on these recommended exchanges:
🟡 Binance🟡 Bitfinex🟡 Bitmart🟡 Bittrex🟡 Bitget
🟡 CoinEx🟡 Crypto.com🟡 Gate.io🟡 Huobi🟡 Kucoin.


Comments