Bitcoin has been getting stable at its crucial support level of $30,000. For over a week now, Bitcoin has been trading near its immediate support level.
Over the last week, the coin lost close to 6% of its value and in the last 24 hours, BTC fell by 3%. The past week has been extremely choppy for Bitcoin and also for the altcoin due to continued market weakness.
The coin had plunged to a low of $25,000, BTC had last traded about that price level in December 2020.
Bitcoin has recovered by $5000, however, a chance of a further downslide cannot be ruled out. The technical of the coin pointed towards continued selling pressure in the market.
Bitcoin Price Analysis: One Day Chart
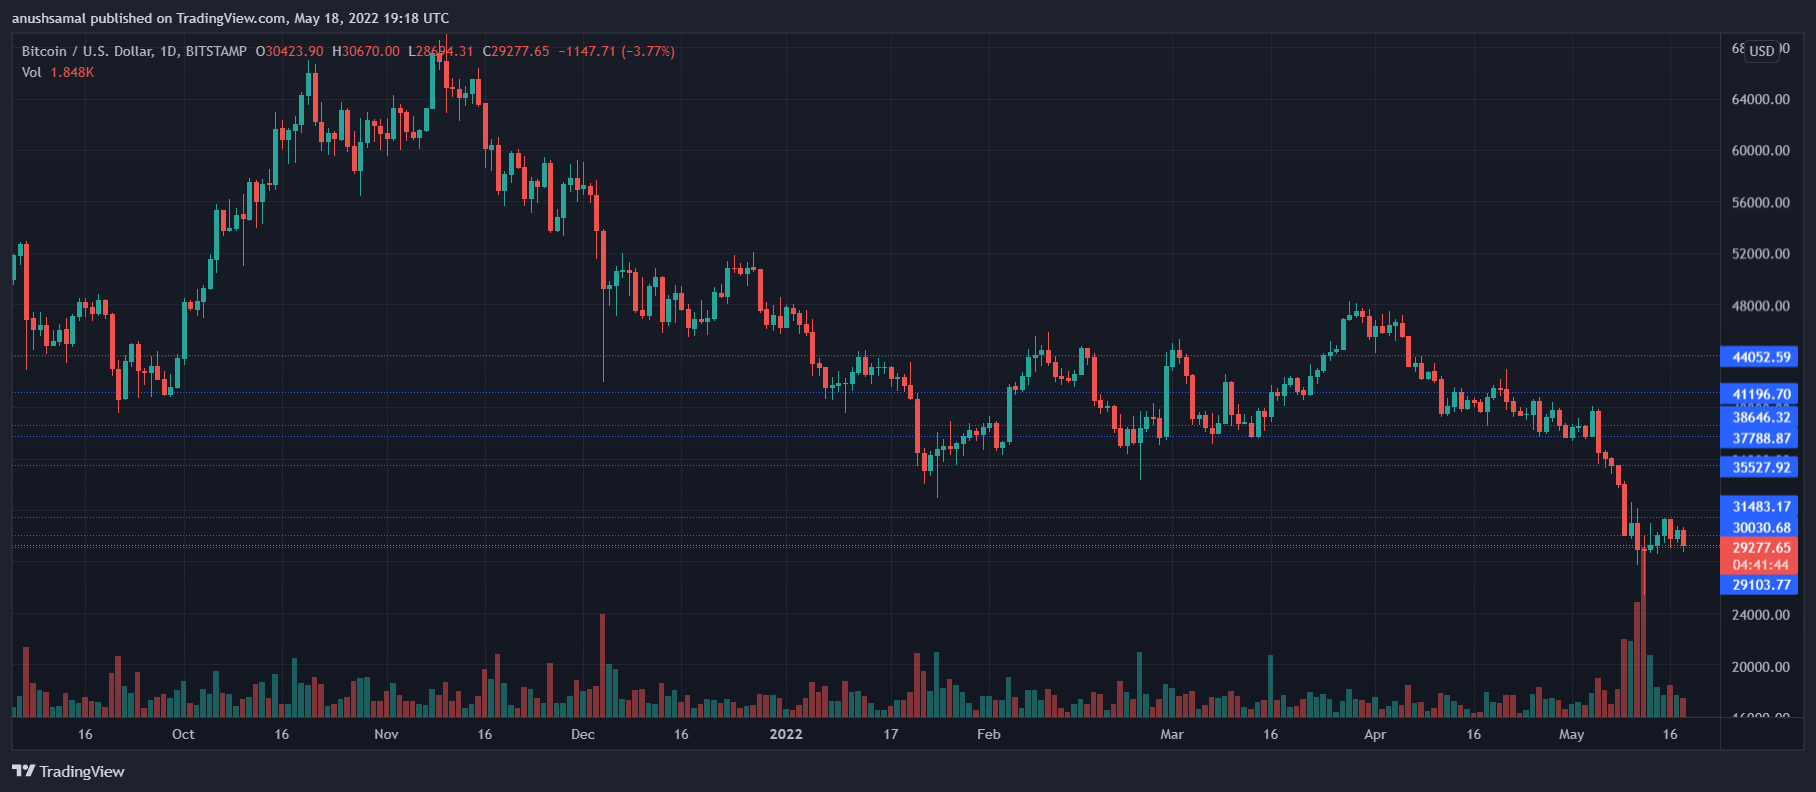
Bitcoin was priced at $29,100 at the time of writing after the coin was rejected from the $31,000 price level. Immediate resistance for the coin stood at $25,000.
A fall beneath the same will send the coin straight to $19,000. On the flip side, if the bulls send a temporary relief then the coin will target moving above the $30,000 price level and trade close to the $31,000 resistance mark.
The volume of Bitcoin traded was seen in the red which indicated bearishness on the one day chart.
Technical Analysis
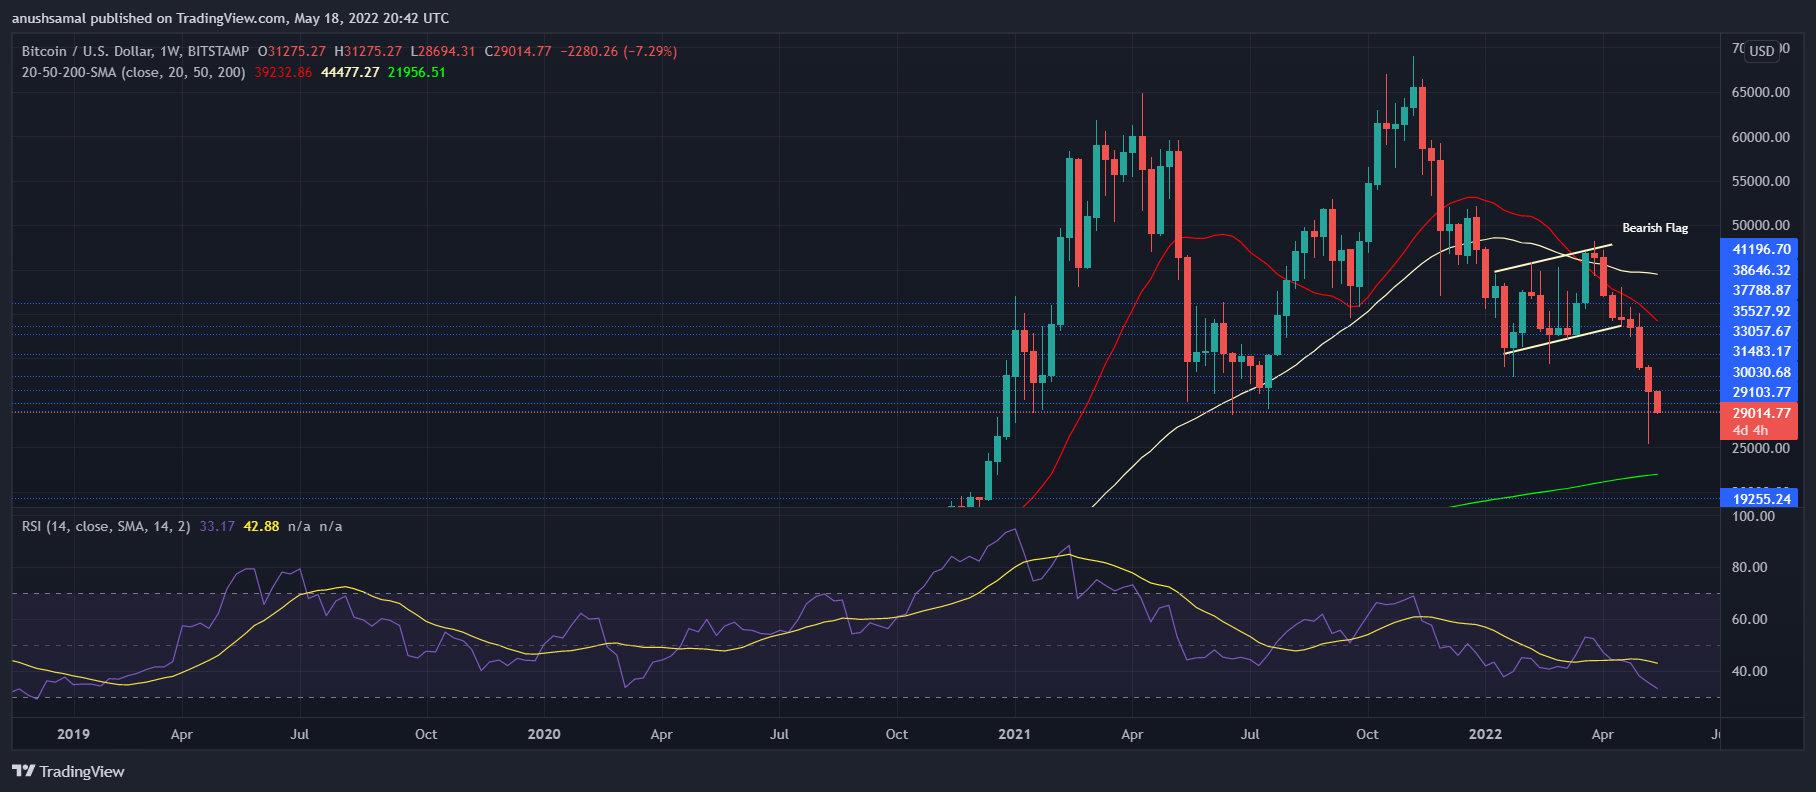
Bitcoin might have been able to show signs of stability on the chart but further signs show that the coin can soon plummet again. King coin was trading underneath the 20-SMA line which meant that sellers were dominating the price momentum in the market.
Support from the buyers can push the coin above the immediate resistance of $30,000. The support from buyers seems like an unlikely situation considering how the coin has formed a bearish flag (yellow).
A bearish flag indicates further push from the bears and this could cause the coin to trade below the $20,000 support mark.
The coin hadn’t touched the $20,000 price level in over a year now. The Relative Strength Index was below the half-line which indicated that sellers are still in charge as shown by the SMA lines.
Related Reading | Bitcoin Bearish Signal: Whales Ramp Up Dumping
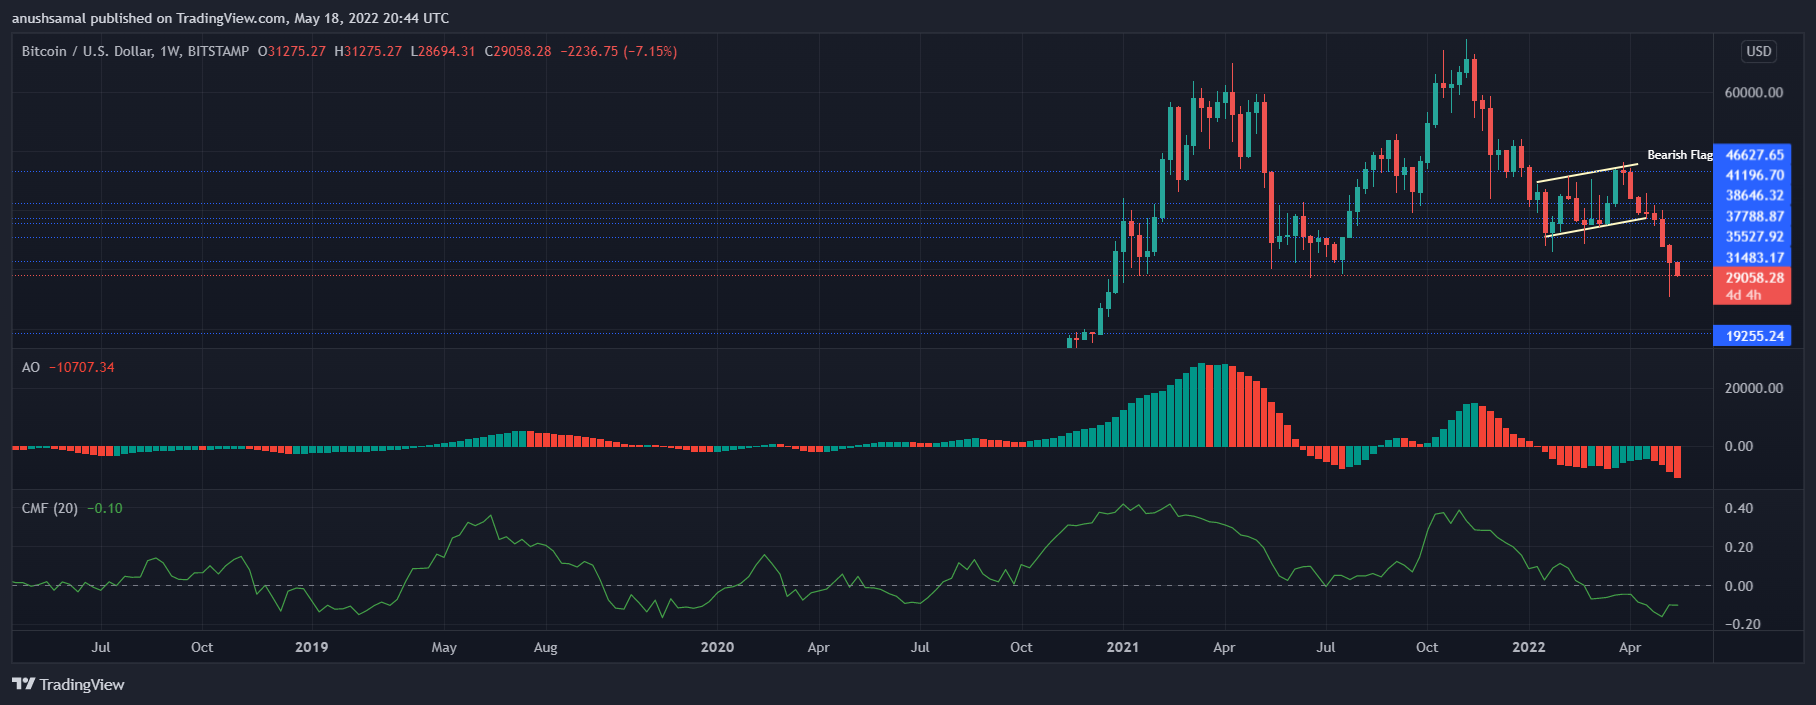
Bitcoin’s bearish flag reflected how the coin continued to fall on the chart after the pattern was formed. The bulls have tired out from the constant battle with sellers. In accordance with the same reading, Awesome Oscillator flashed bearishness.
The indicator dictates the price momentum of the market and red histograms underneath the half-line meant a sell signal for the coin.
If sellers continue to act on it, $20,000 can soon be on the charts. Chaikin Money Flow is responsible for depicting capital inflows and outflows. The indicator was below the half line because capital outflows were still dominant at press time.
Related Reading | TA: Bitcoin Eyes Fresh Increase But This Level Is The Key
Tags: bitcoinprice analysis

You can get bonuses upto $100 FREE BONUS when you:
💰 Install these recommended apps:
💲 SocialGood - 100% Crypto Back on Everyday Shopping
💲 xPortal - The DeFi For The Next Billion
💲 CryptoTab Browser - Lightweight, fast, and ready to mine!
💰 Register on these recommended exchanges:
🟡 Binance🟡 Bitfinex🟡 Bitmart🟡 Bittrex🟡 Bitget
🟡 CoinEx🟡 Crypto.com🟡 Gate.io🟡 Huobi🟡 Kucoin.


Comments