On-chain data shows the Bitcoin taker buy/sell ratio is now lighting up a “buy” signal as the price of the crypto begins to take off.
Bitcoin Taker Buy Sell Ratio Suggests Now May Be A Good Time To Buy
As explained by an analyst in a CryptoQuant post, the taker buy sell ratio metrics can be used to find viable entry and exit spots in the market.
The “Bitcoin taker buy volume” is an indicator that measures the volume of buy orders filled by takers in perpetual swaps. Similarly, the “taker sell volume” measures the amount of sell orders.
The “taker buy ratio” (or its sell counterpart) is defined as the ratio between the buy volume and the total volume on perpetual swaps.
When the value of the taker buy ratio goes up, it means the buyers are currently willing to buy coins at a higher price. Such a trend shows that the buying pressure is currently stronger than the selling pressure.
On the other hand, taker sell ratio moving up would indicate a shift towards a more bearish sentiment in the market.
Related Reading | Is The Bitcoin Bottom In? Here’s What SOPR Data Says
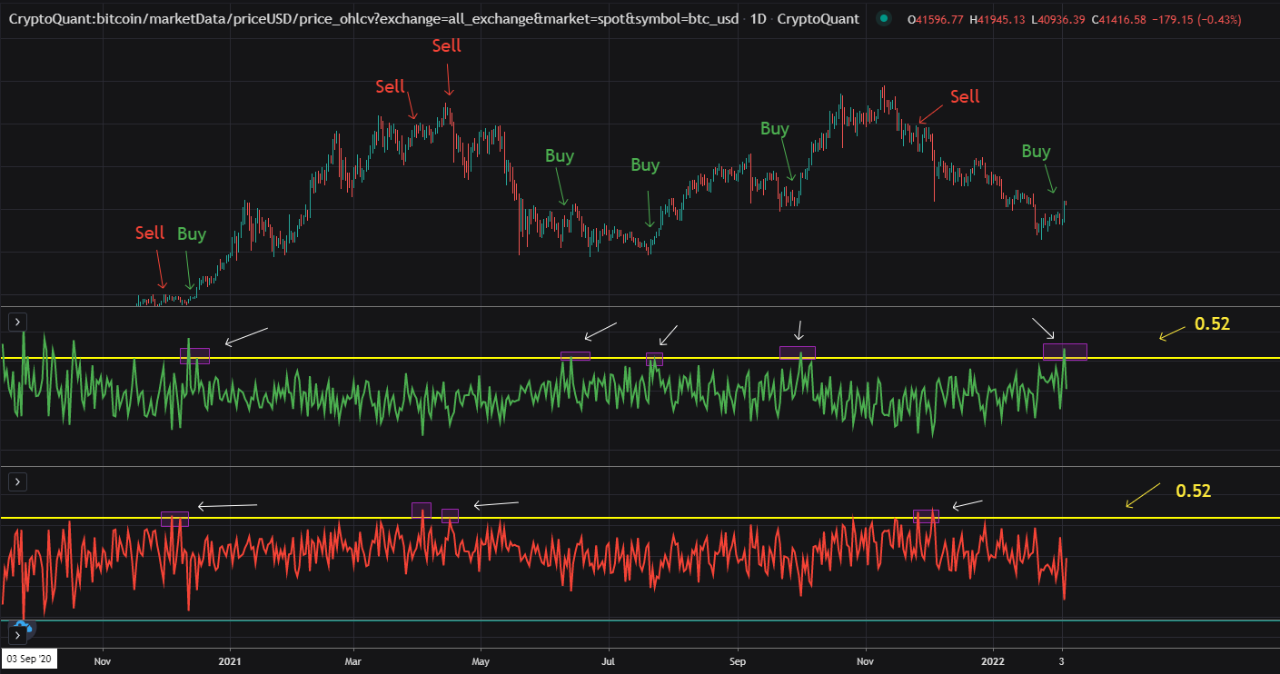
Now, here is a chart that shows the trend in these indicators over the past couple of years:

The taker buy ratio seems to have crossed the 0.52 mark recently | Source: CryptoQuant
As you can see in the above graph, the quant has marked the important periods of trend. It looks like whenever the taker buy ratio has moved above the 0.52 level, a buying spot has been signaled for Bitcoin.
On the other hand, the taker sell ratio touching similar values has historically indicated a selling point for the crypto.
Related Reading | The Bear Signal That Suggests Another Bitcoin Crash Is Coming
It seems the value of the taker buy ratio just passed the 0.52 mark recently, suggesting around now may be an ideal buying opportunity for Bitcoin.
BTC Price
At the time of writing, Bitcoin’s price floats around $43.3k, up 12% in the last seven days. Over the past month, the crypto has accumulated 4% in gains.
The below chart shows the trend in the price of BTC over the last five days.

BTC's price has shown some sharp uptrend over the past week | Source: BTCUSD on TradingView
After a long period of downwards movement, Bitcoin has finally enjoyed some constant uptrend over the past week. Earlier in the day, the coin’s price briefly broke above $45k before sliding down to the current levels.
It’s unclear at the moment if this trend will continue, or if it’s just a bull trap. However, if the taker buy ratio is anything to consider, the outcome of the coin may be bullish.
Featured image from Unsplash.com, charts from TradingView.com, CryptoQuant.com
Tags: bitcoinBitcoin BullishBitcoin Buy SignalBitcoin Taker Buy/Sell Ratiobtcbtcusd

You can get bonuses upto $100 FREE BONUS when you:
💰 Install these recommended apps:
💲 SocialGood - 100% Crypto Back on Everyday Shopping
💲 xPortal - The DeFi For The Next Billion
💲 CryptoTab Browser - Lightweight, fast, and ready to mine!
💰 Register on these recommended exchanges:
🟡 Binance🟡 Bitfinex🟡 Bitmart🟡 Bittrex🟡 Bitget
🟡 CoinEx🟡 Crypto.com🟡 Gate.io🟡 Huobi🟡 Kucoin.


Comments