
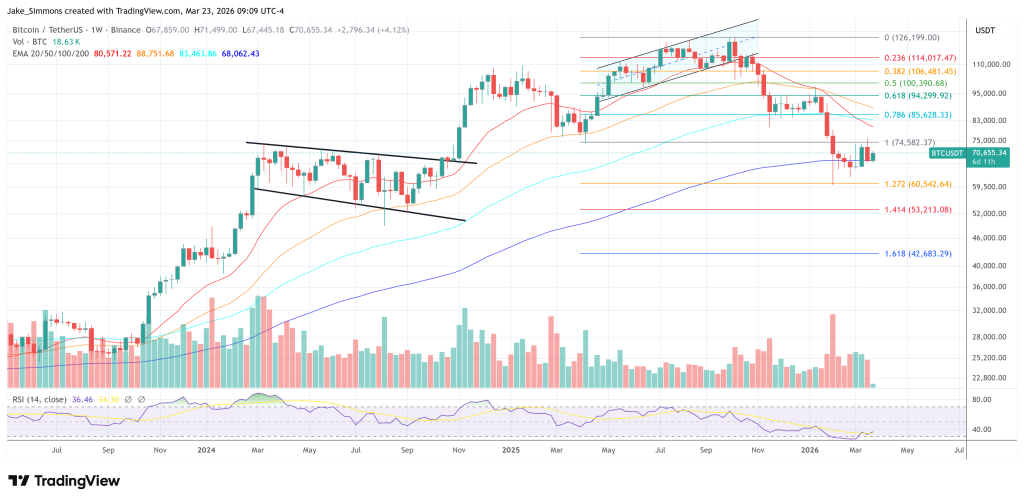
On Monday, the valuation of bitcoin experienced a 3.3% decline within the past day, falling beneath the $42K threshold. Currently positioned at $42,224, bitcoin’s valuation is undergoing a marked shift in the cryptocurrency landscape on Dec. 11, 2023, just two days prior to the forthcoming meeting of the U.S. Federal Reserve.
Bitcoin
The recent pricing trends of bitcoin (BTC), oscillating between $41,783 and $44,019, demonstrate a significant degree of market volatility. This is further highlighted by bitcoin’s substantial market capitalization of $828 billion and a 24-hour trading volume reaching $27.56 billion, emphasizing its significant impact on the crypto economy. Market oscillators provide insights into the current market sentiment.
The relative strength index (RSI), at 63, indicates a neutral to slightly bearish outlook. Conversely, the Stochastic oscillator signals a bearish trend at 82, pointing to overbought conditions and suggesting a possible waning of bullish momentum. Similarly, the commodity channel index (CCI) at 58 mirrors this neutral to bearish sentiment, further underscoring the market’s current state of uncertainty.
The story told by moving averages is dual in nature. Short-term EMAs (exponential moving averages) and SMAs (simple moving averages) for the 10-day span, project a negative market view, mirroring recent downturns in price. On the contrary, longer-term EMAs and SMAs, stretching from 20-day to 200-day periods, consistently indicate sustained bullish presence. This split suggests a possible bullish undertone amidst current bearish pressures.
Daily chart analysis uncovers a previous uptrend now overshadowed by a significant decline starting at 7:00 p.m. Eastern Time on Sunday. This decline, coupled with high volume, emphasizes the present selling force. Critical levels are set by the established support near $35,002 and resistance around $44,729, serving as pivotal points for future pricing movements. The 4-hour chart presents a more distinct bearish sentiment, with a clear downtrend and dips surpassing prior lows. Increased volatility and volume validate this strong bearish inclination in the short term.
Bull Verdict:
Despite the prevailing short-term bearish indicators, bitcoin’s long-term prospects appear positive. Extended-period moving averages continue to signal a buying opportunity, suggesting inherent strength and endurance in the market. This, alongside the RSI’s neutral position, hints that the present downturn might be a brief setback within an ongoing bullish trajectory.
Bear Verdict:
Current market indicators are tilting towards a bearish forecast for bitcoin. The immediate selling pressures, as depicted in the 4-hour chart and short-term moving averages, foreshadow a potential downward trajectory. The overbought state indicated by the Stochastic oscillator further bolsters this bearish viewpoint.
Register your email here to get weekly price analysis updates sent to your inbox:
What do you think about bitcoin’s market action on Monday morning? Share your thoughts and opinions about this subject in the comments section below.

You can get bonuses upto $100 FREE BONUS when you:
💰 Install these recommended apps:
💲 SocialGood - 100% Crypto Back on Everyday Shopping
💲 xPortal - The DeFi For The Next Billion
💲 CryptoTab Browser - Lightweight, fast, and ready to mine!
💰 Register on these recommended exchanges:
🟡 Binance🟡 Bitfinex🟡 Bitmart🟡 Bittrex🟡 Bitget
🟡 CoinEx🟡 Crypto.com🟡 Gate.io🟡 Huobi🟡 Kucoin.


Comments