Data shows the Bitcoin trading volume is now once again moving sideways at a low average value as activity on the network slows down to a crawl.
Bitcoin Average Daily Trading Volume Returns Back To Below $4 Billion
As per the latest weekly report from Arcane Research, the 7-day average BTC spot volume has once again moved flat during the last week.
The “trading volume” is an indicator that measures the total amount of Bitcoin that changed hands on the Bitcoin network on any given day.
When the value of this metric goes up, it means the total number of coins being involved in transactions on the chain is going up right now. Such a trend suggests the BTC blockchain is getting more activity now.
Related Reading | Bitcoin Bear Market Sends On-Chain Metrics Into Sideways Trend
On the other hand, declining values of the indicator can mean the general trader interest around the crypto may be going down as activity on the network is reducing.
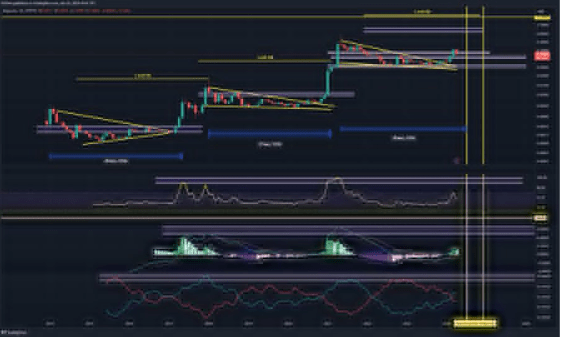
Now, here is a chart that shows the trend in the 7-day average daily Bitcoin trading volume over the past year:

The value of the indicator seems to have been quite low in recent days | Source: Arcane Research's The Weekly Update - Week 26, 2022
As you can see in the above graph, the daily Bitcoin spot trading volume showed a large spike in June. However, since then, the metric’s value has plummeted down.
During the last seven days, the value of the indicator has been less than $4 billion, which is much lower than the average for the last year. This is despite the market seeing some volatility in this period.
Related Reading | Was Dan Peña Right That Bitcoin (BTC) Is Dead? Small, Quality Projects Like Gnox (GNOX) Look To Be New Crypto VC Haven
Thursday and Friday did observe spikes above $5 billion, but the very low weekend volumes of just $2 billion negated the effect of these high values.
Saturday especially saw the lowest daily value since the start of June. The report notes that the low volumes were likely influenced by the 4th July weekend in the US.
BTC Price
At the time of writing, Bitcoin’s price floats around $20.5k, up 8% in the last seven days. Over the past month, the crypto has lost 33% in value.
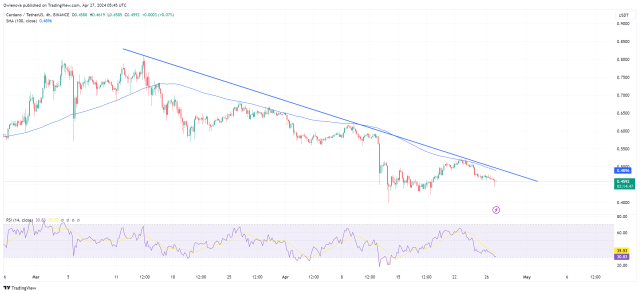
The below chart shows the trend in the price of the coin over the last five days.

Looks like the value of the crypto has been going up over the last few days | Source: BTCUSD on TradingView
After struggling around the $19k value for a while, Bitcoin seems to have finally started to make some ground above the $20k level in the past few days.
Featured image from Kanchanara on Unsplash.com, charts from TradingView.com, Arcane Research

You can get bonuses upto $100 FREE BONUS when you:
💰 Install these recommended apps:
💲 SocialGood - 100% Crypto Back on Everyday Shopping
💲 xPortal - The DeFi For The Next Billion
💲 CryptoTab Browser - Lightweight, fast, and ready to mine!
💰 Register on these recommended exchanges:
🟡 Binance🟡 Bitfinex🟡 Bitmart🟡 Bittrex🟡 Bitget
🟡 CoinEx🟡 Crypto.com🟡 Gate.io🟡 Huobi🟡 Kucoin.


Comments