On-chain data shows the Bitcoin transaction volume has seen a sharp plunge since its high last year. Here’s what this could imply for BTC.
Bitcoin Transfer Volume Has Declined To Just $11.2 Billion
In a new post on X, the on-chain analytics firm Glassnode has talked about the latest trend in the Total Transfer Volume for Bitcoin. The “Total Transfer Volume” here refers to a metric that measures the total amount of the cryptocurrency (in USD) that’s becoming involved in transactions on the network every day.
When the value of this indicator is high, it means the investors are moving around large amounts on the blockchain. Such a trend suggests the trading interest in the asset is high.
On the other hand, the metric being low implies the traders may not be paying much attention to the asset as they aren’t participating in much transaction activity.
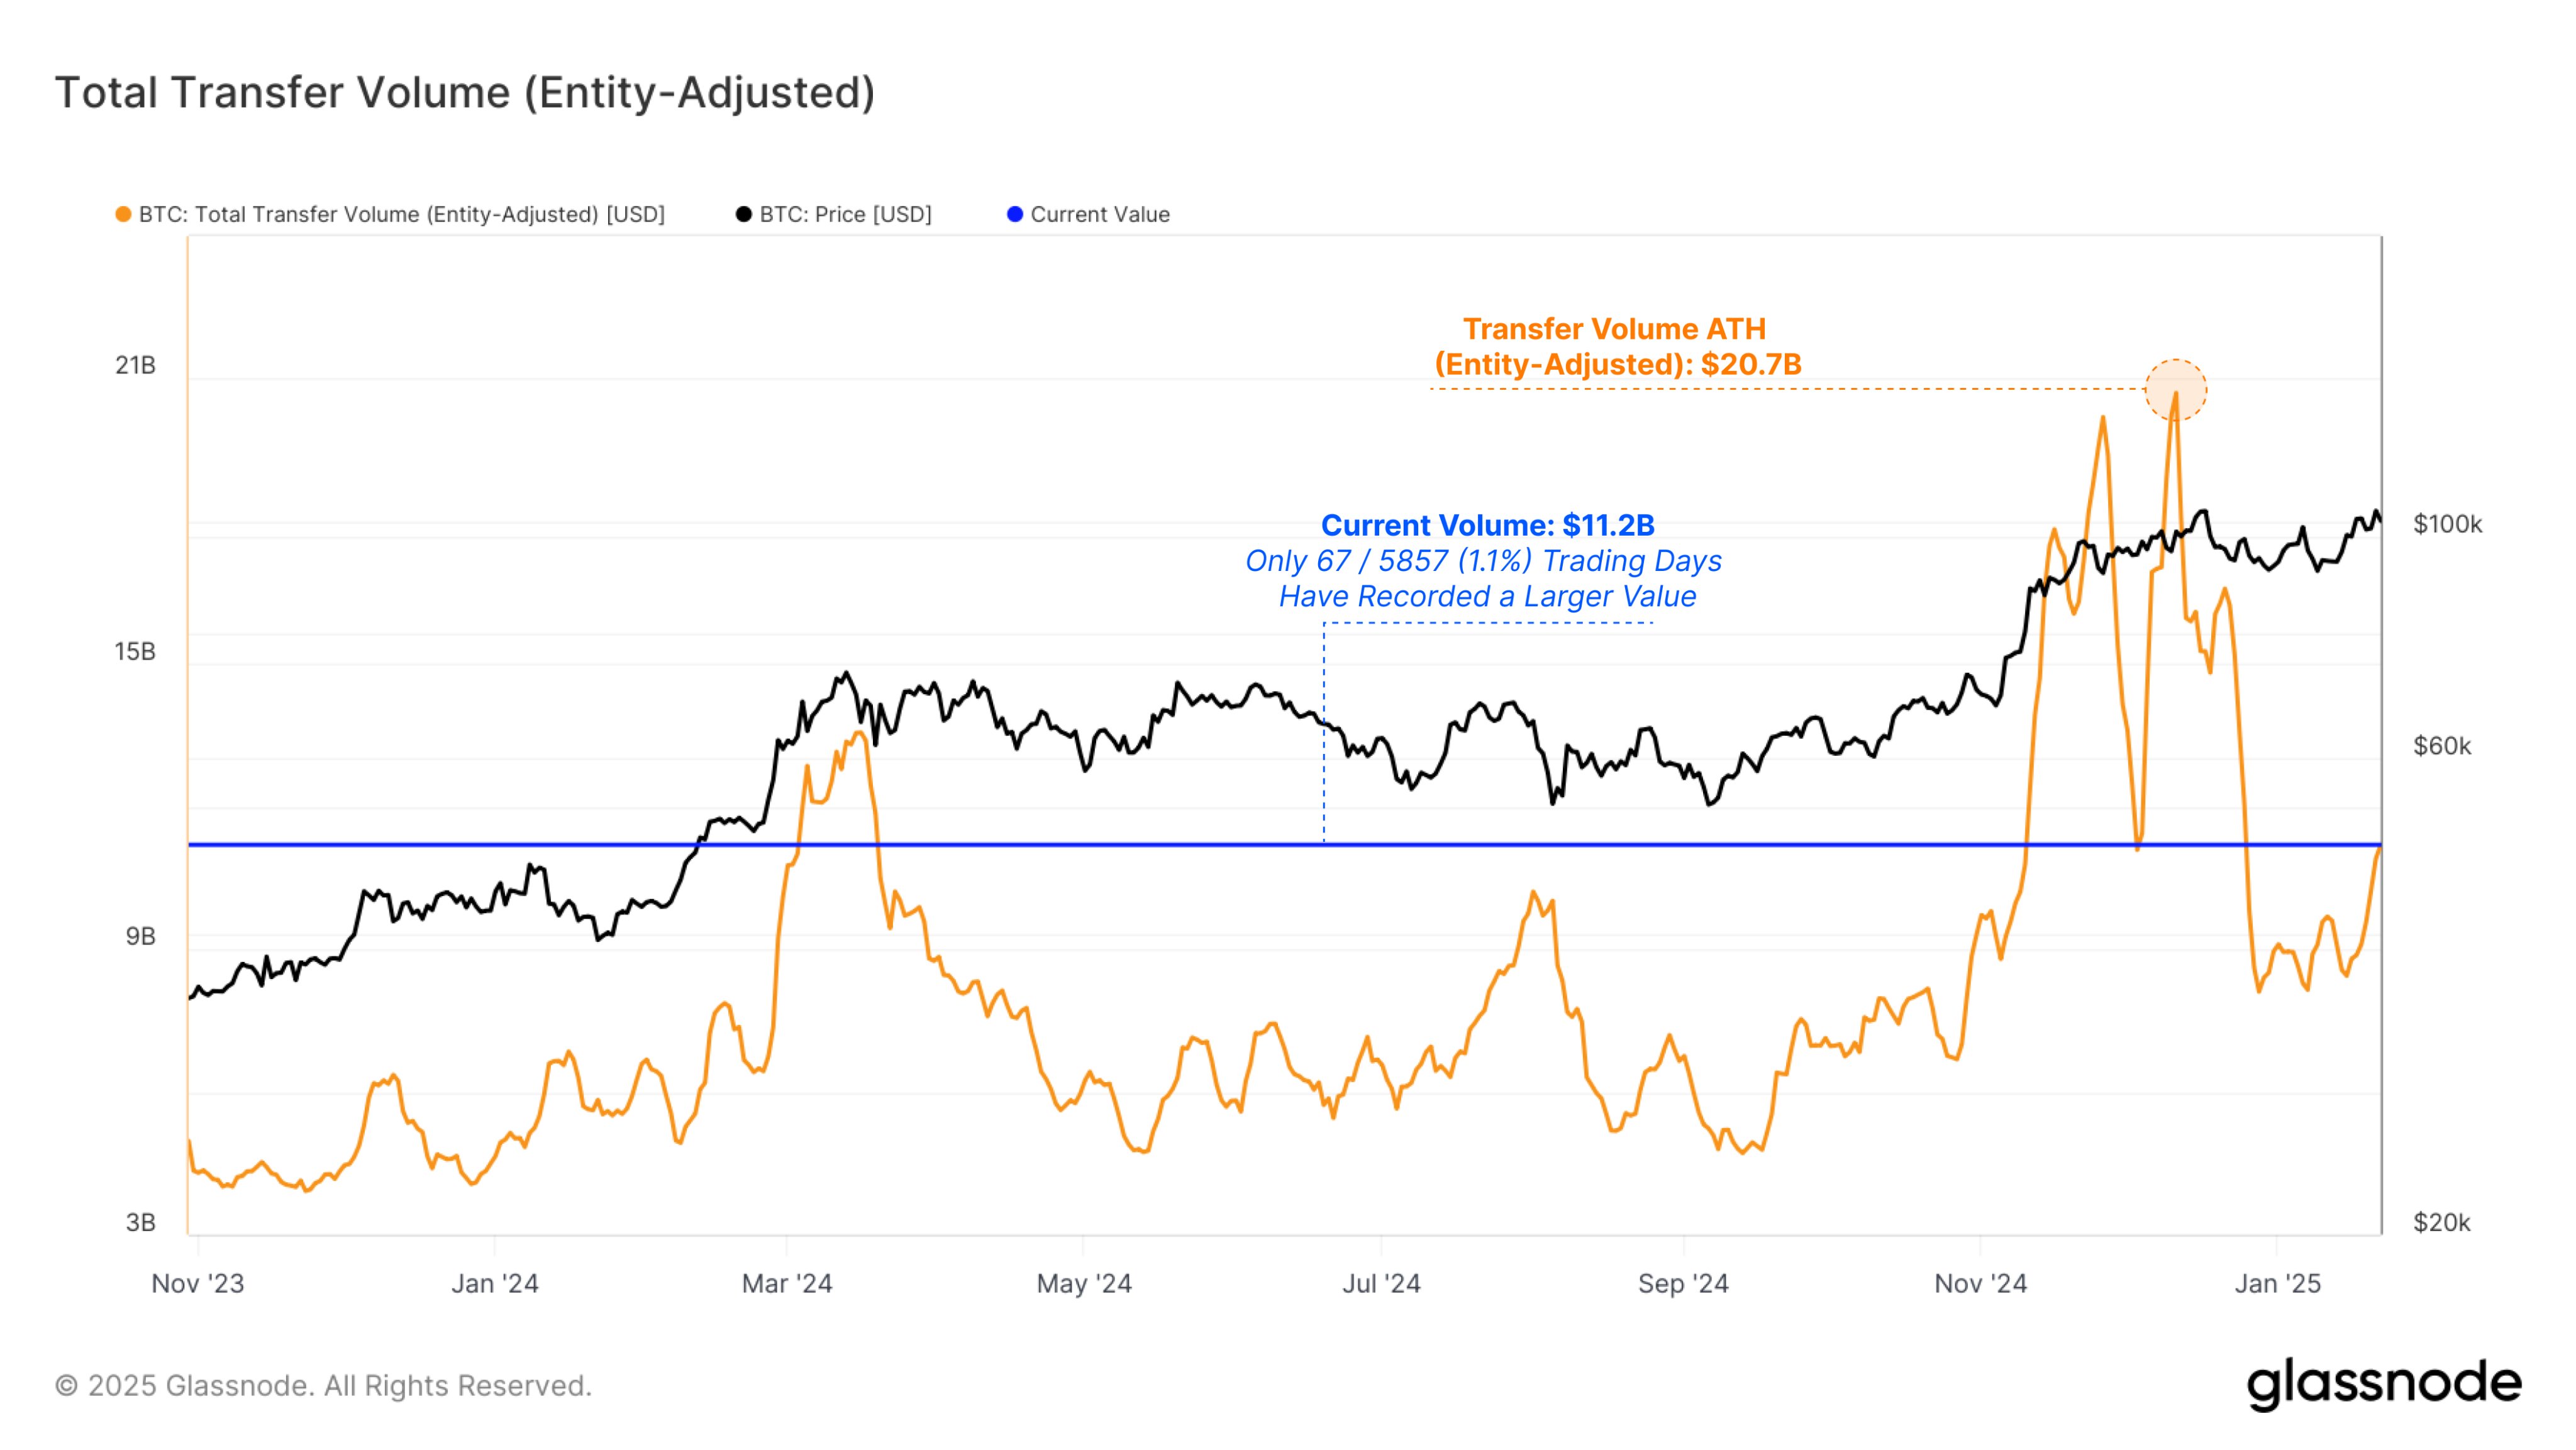
Now, here is the chart shared by Glassnode, that shows the trend in the Bitcoin Total Transfer Volume over the last couple of years:
In the graph, the version of the Bitcoin Total Transfer Volume displayed is the “Entity-Adjusted” one. What this means is that the indicator only keeps track of the transfers happening between different entities, not individual addresses.
An ‘entity‘ is a cluster of addresses that the analytics firm has determined to belong to the same investor. Transactions between the wallets of the same owner are naturally not relevant for the wider market, so adjusting for entities can make the indicator output more accurate results.
From the chart, it’s visible that the Entity-Adjusted Total Transfer Volume witnessed a sharp surge towards the end of last year. This increase in the indicator came as the cryptocurrency explored new all-time highs (ATHs) beyond the $100,000 mark.
Investors usually find such rallies to be exciting, so it’s not surprising that the one from the last couple of months of 2024 also amassed a large amount of attention.
Since hitting an ATH of $20.7 billion in December, though, the metric has witnessed an extended drawdown, implying activity has waned on the network. Today, the chain is processing just $11.2 billion in inter-entity volume, a decrease of almost 46% from the peak.
Transaction activity from the investors is what provides the fuel for rallies to be sustainable, which may be why the slowdown in the cryptocurrency’s price has come after the drawdown in the volume.
That said, while the latest volume is significantly lower than the ATH, it’s actually still really high when compared to history. As Glassnode has highlighted in the chart, there have only been 67 days in BTC’s lifetime where the network has seen a higher amount of transaction activity.
BTC Price
At the time of writing, Bitcoin is trading around $105,300, up almost 3% in the last seven days.

You can get bonuses upto $100 FREE BONUS when you:
💰 Install these recommended apps:
💲 SocialGood - 100% Crypto Back on Everyday Shopping
💲 xPortal - The DeFi For The Next Billion
💲 CryptoTab Browser - Lightweight, fast, and ready to mine!
💰 Register on these recommended exchanges:
🟡 Binance🟡 Bitfinex🟡 Bitmart🟡 Bittrex🟡 Bitget
🟡 CoinEx🟡 Crypto.com🟡 Gate.io🟡 Huobi🟡 Kucoin.


Comments