On-chain data shows Bitcoin whale inflows to exchanges have remained at highest ever levels recently, suggesting that the latest recovery above $22k may not last too long.
Bitcoin Top 10 Exchange Inflows Have Been Elevated In Recent Days
As pointed out by an analyst in a CryptoQuant post, the current whale deposits to exchanges are at their highest value in the history of the crypto.
The “all exchanges inflow” is an indicator that measures the total amount of Bitcoin currently entering into wallets of all centralized exchanges.
The sum of the top ten inflows, specifically, represents the total number of coins being deposited by BTC whales.
When the value of this metric is high, it means whales are currently depositing a large amount of Bitcoin right now. Since investors usually transfer to exchanges for selling purposes, such a trend could point at dumping from whales, and hence can be bearish for the value of the coin.
On the other hand, a low value of the metric implies whales are depositing a healthy amount to exchanges at the moment. This kind of trend can be either bullish or neutral for BTC, depending on whether buying is also going on in the market currently.
Related Reading | Bitcoin Breaks Above Realized Price Again, Bottom Finally In?
Now, here is a chart that shows the trend in the BTC top 10 inflows (21-day moving average) over the last few years:
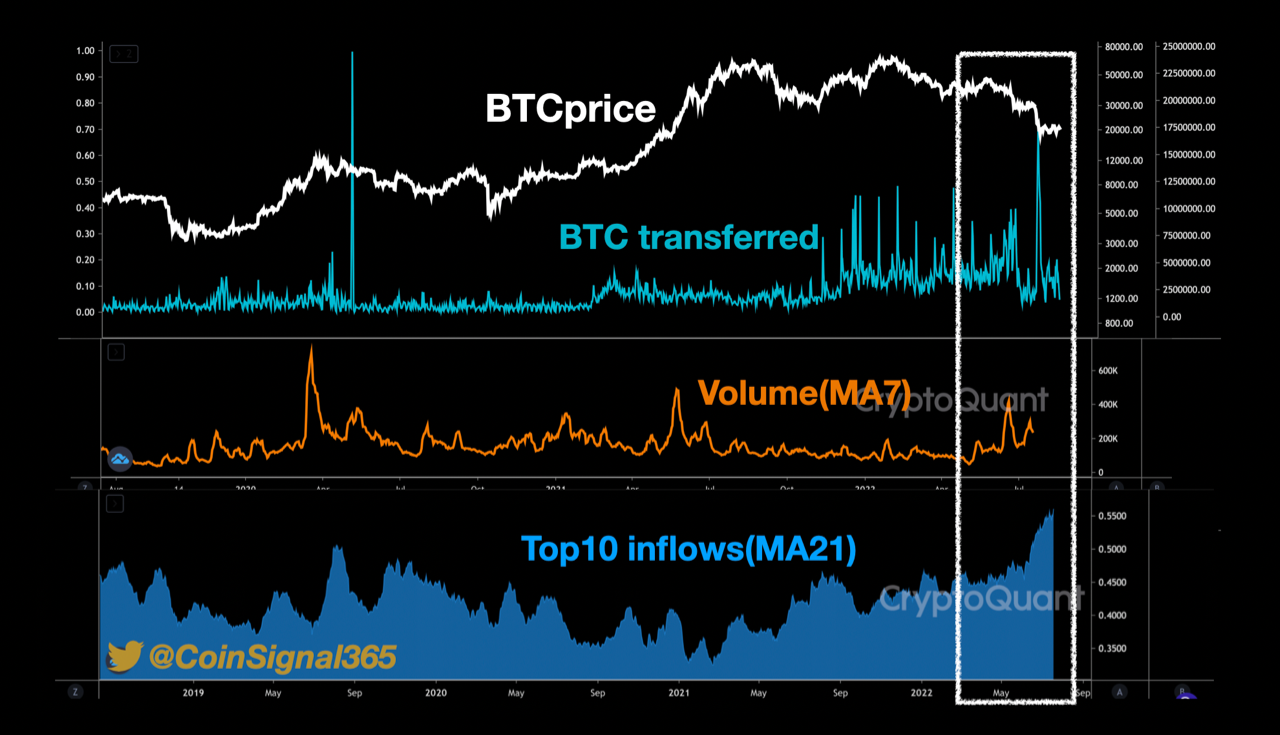
Looks like the value of the indicator has observed rise in the last few weeks | Source: CryptoQuant
As you can see in the above graph, the 21-day MA Bitcoin top ten inflow has been at all-time high values recently.
This suggests that whales are currently depositing to exchanges at a rate never seen before in the history of the crypto. If these whales are planning to sell their coins, then the outcome could be bearish for BTC, which would mean the latest rally to $22k may not last for long.
Related Reading | Sleeping Giant Awakens, Bitcoin Sees Spike In Transactions Valued Above $1 Million
The quant has also displayed the data for the BTC volume in the same chart. It seems like the volume of the coin hasn’t been too high recently. This could imply that the latest rally may be driven by a few whales and not organic activity, further suggesting the increase might be short lived.
BTC Price
At the time of writing, Bitcoin’s price floats around $22k, up 11% in the past week. The below chart shows the trend in the value of the crypto over the last five days.

The price of the coin seems to have surged up over the last few days | Source: BTCUSD on TradingView
Featured image from Rémi Boudousquié on Unsplash.com, charts from TradingView.com, CryptoQuant.com

You can get bonuses upto $100 FREE BONUS when you:
💰 Install these recommended apps:
💲 SocialGood - 100% Crypto Back on Everyday Shopping
💲 xPortal - The DeFi For The Next Billion
💲 CryptoTab Browser - Lightweight, fast, and ready to mine!
💰 Register on these recommended exchanges:
🟡 Binance🟡 Bitfinex🟡 Bitmart🟡 Bittrex🟡 Bitget
🟡 CoinEx🟡 Crypto.com🟡 Gate.io🟡 Huobi🟡 Kucoin.


Comments