- Bitcoin’s price correction has the potential to continue, as the daily MACD formed a signal that has consistently indicated short-term bearish dominance.
- Rising leverage and funding rates reflect growing speculative interest but increase the risk of liquidation cascades if major support levels give way.
- Wallets holding 100-1,000 BTC led Bitcoin accumulation over the last three months, indicating a potential bullish trend over the next 6-12 months.
Weekly outlook
Could a V turn into a W?
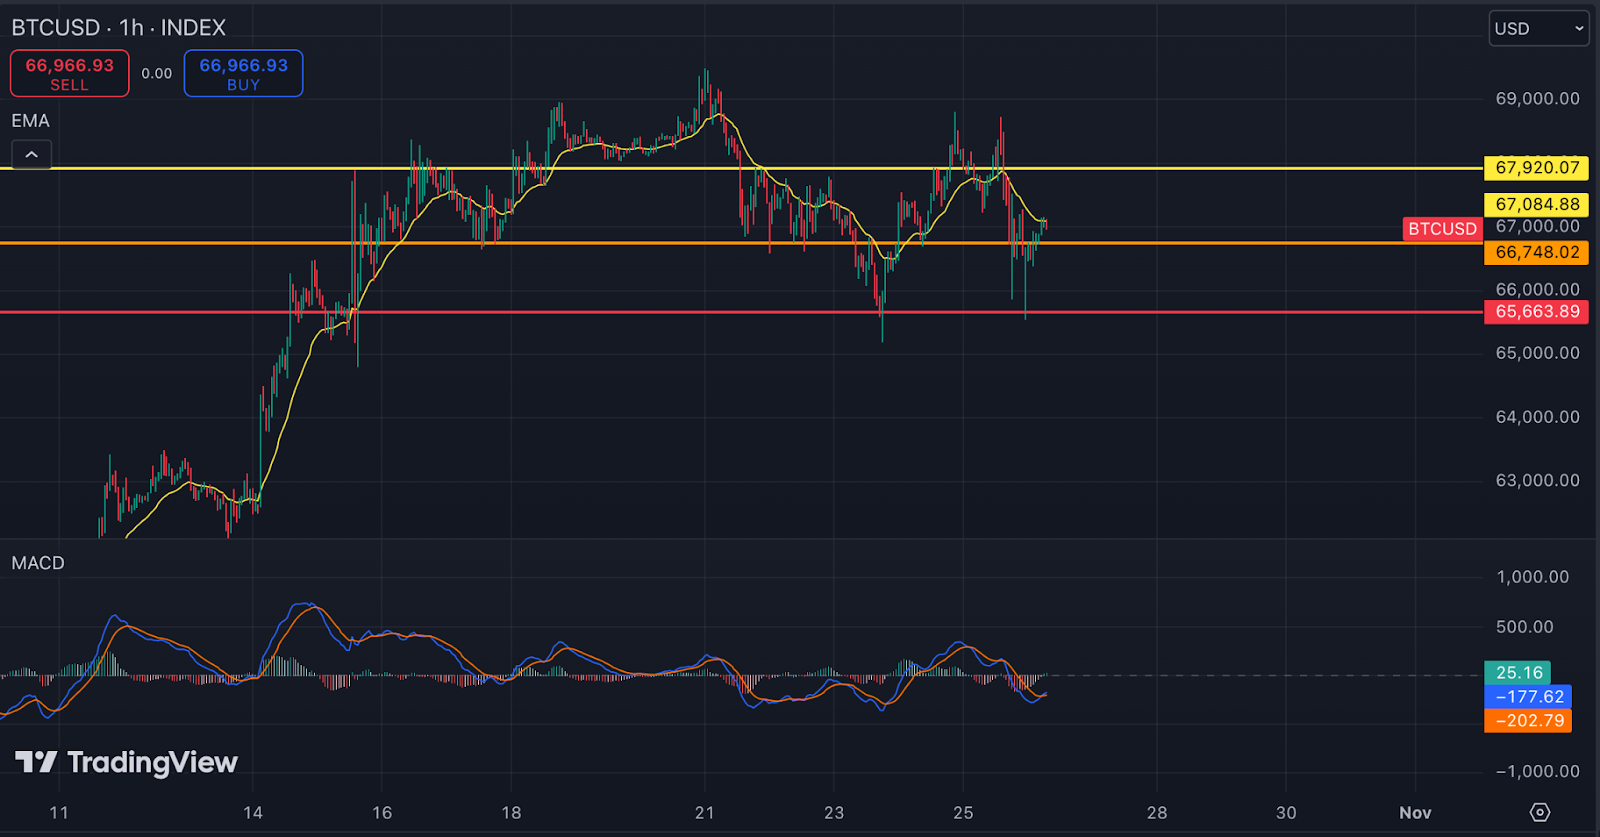
Over the past week, Bitcoin has displayed a V-shaped price movement, consolidating within a narrow range between $66,700 and $67,700 before briefly testing both $65,300 and $69,000. In our previous analysis, we highlighted that Bitcoin could see imminent correction and/or consolidation throughout last week, as bullish momentum appeared to weaken.
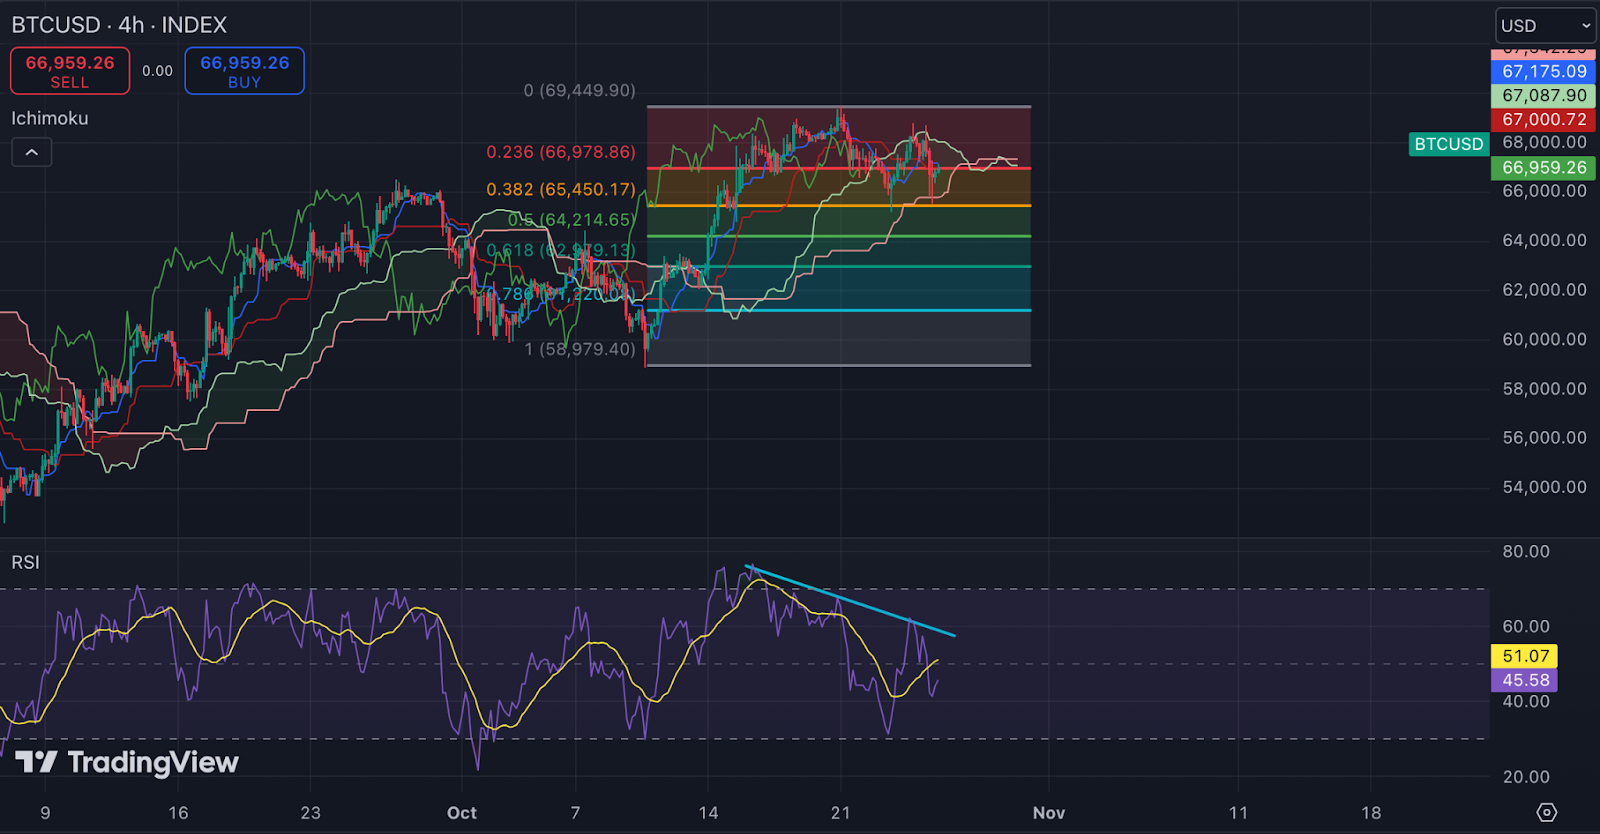
On the 4-hour chart, the RSI indicator remains in a downtrend (cyan line), suggesting the corrective phase may not be over. At the time of this writing, Bitcoin’s price is trading within the Ichimoku Cloud, with its upper and lower boundaries acting as resistance and support, respectively — indicating market indecision. A breakout outside this cloud could determine whether Bitcoin tests $69,500 or retreats to lower levels.&
While a short-term recovery is possible, it may struggle to gain traction unless the RSI breaks through its resistance. VPVR analysis shows high volume clusters around the 0.236, 0.382, and 0.618 Fibonacci retracement levels, suggesting these as key support/resistance zones.
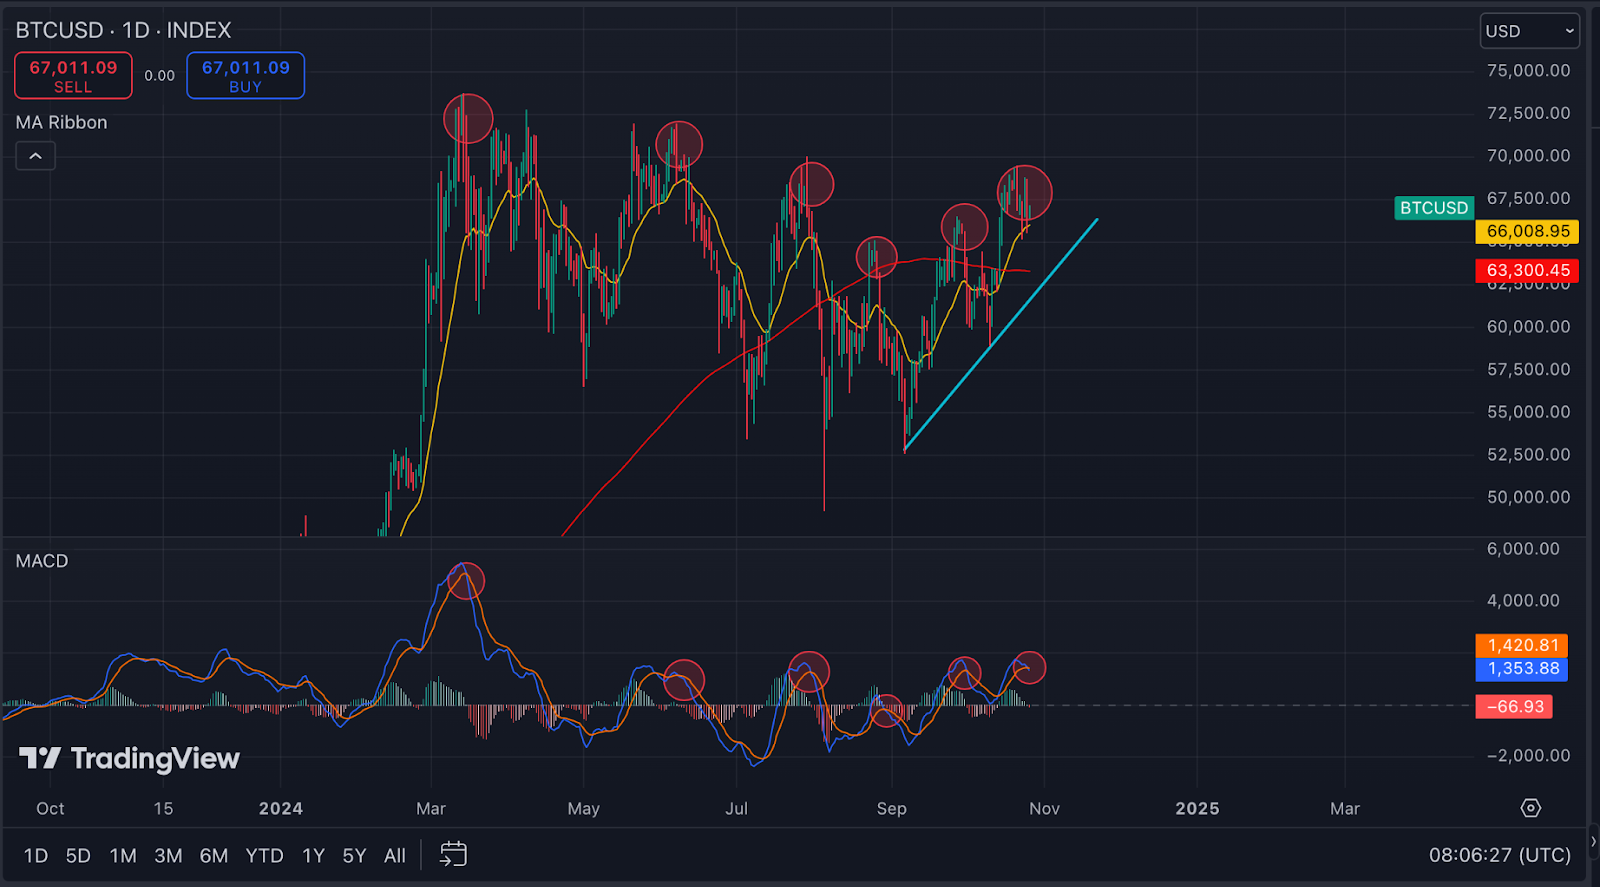
The daily chart indicates a possible continuation of the correction, as the asset formed a bearish divergence with Awesome Oscillator (AO), and a bearish crossover with MACD. Over the last 8 months, the latter typically coincided with local tops (red circles), hinting at short-term bearish dominance. This could push the price below the 20-day EMA, with the 200-day SMA as a potential target. However, the 20-day EMA, near $66,000, remains a key support for bulls; defending this level could weaken the bearish case.
Futures market speculations are getting riskier
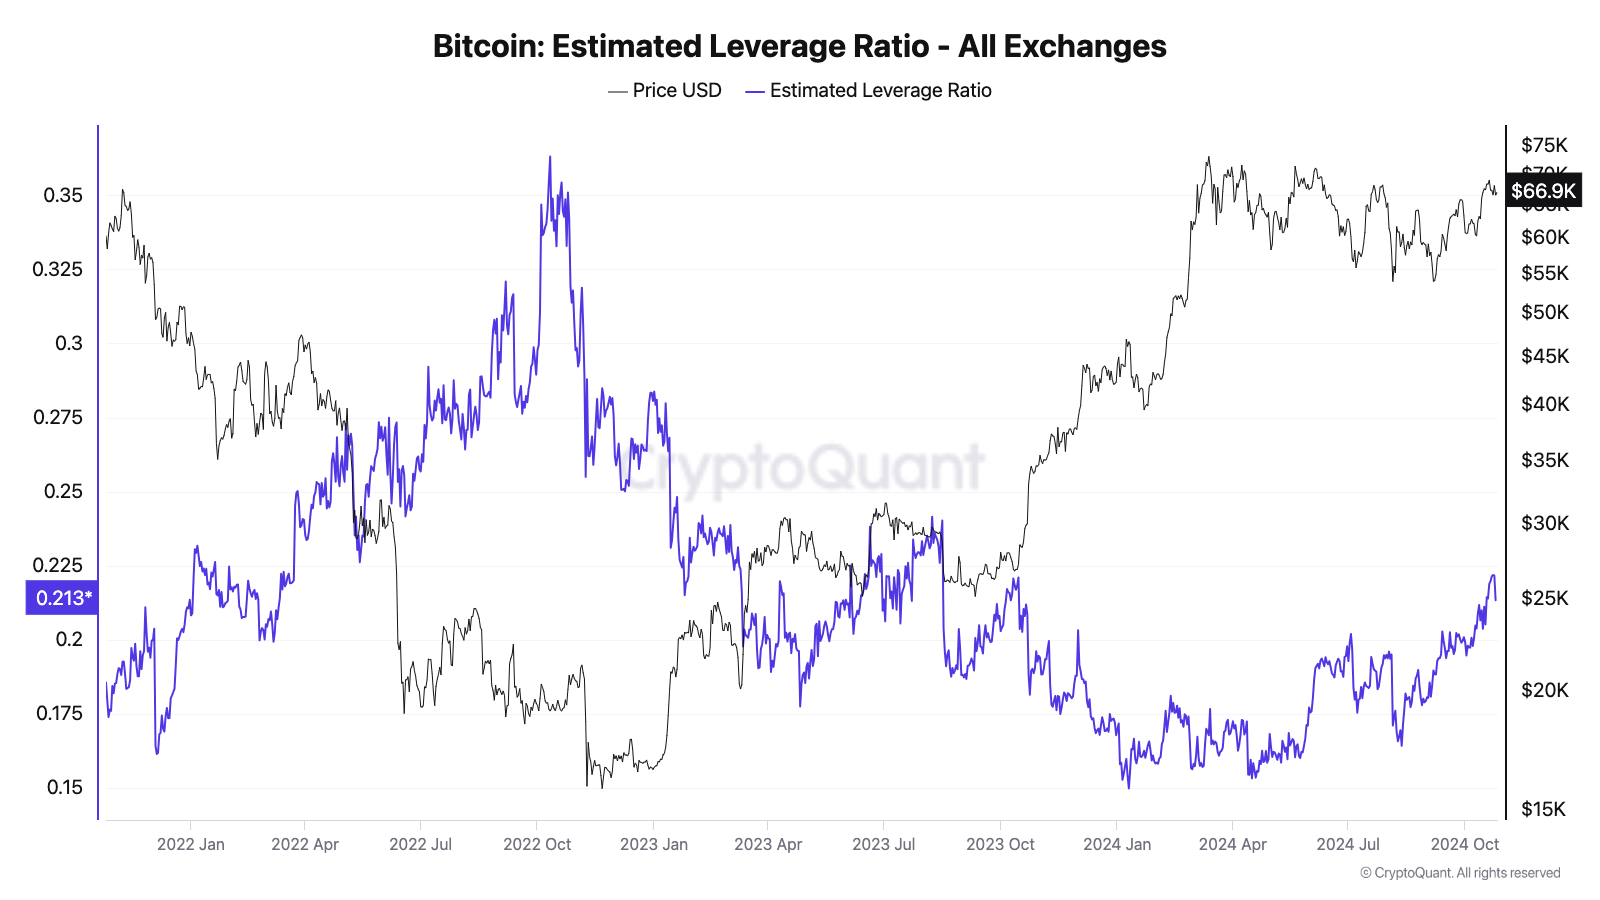
Last week, we noted that spikes in Bitcoin open interest often precede short-term corrections. Following the recent jump, Bitcoin’s futures open interest dropped by 7%, while futures volume remained relatively flat. Meanwhile, funding rates have risen on average, and the estimated leverage ratio has jumped to its highest level since August 2023. This increase in leverage suggests heightened speculative optimism but raises the risk of sharp liquidation cascades.
These conditions suggest that Bitcoin could see increased volatility in the short term. A breakdown below the 20-day EMA or other major support levels could trigger increased liquidations, potentially exerting additional downward pressure and potentially intensifying a corrective phase.
Source: CryptoQuant
Longer-term outlook
Sharks return to the tank
Bitcoin whale activity is intensifying, with whale numbers reaching their highest since January 2021, while whale accumulation levels are at a peak not seen since July 2020. Examining holder cohorts reveals that “sharks” (wallets holding 100-1,000 BTC) have led the recent accumulation, collectively adding over 200,000 BTC in the past three months. Historically, such accumulation by sharks has preceded prolonged bullish rallies, as similar patterns were seen roughly six months after the halvings in both 2016 and 2020, before further upward price movement.
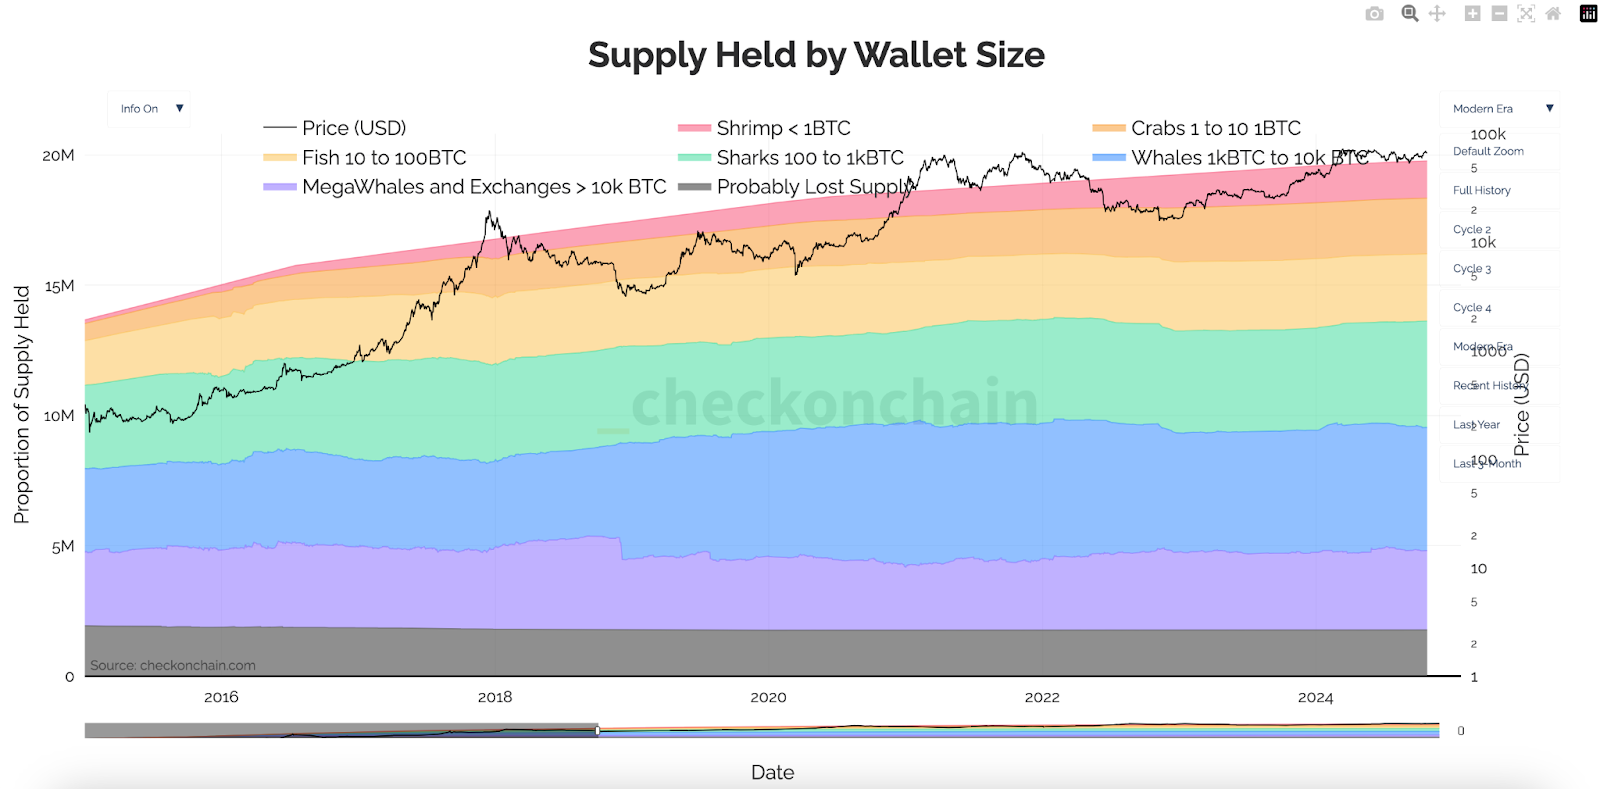
Source: Checkonchain
Revived supply shows bullish signs
Bitcoin wallets with a 2-4 year holding period are increasingly active, now representing about 42% of the recently revived supply, up from 29% three months ago. In past cycles, rising activity among these holders has often foreshadowed a rally, as they tend to become increasingly active 6-12 months before the cycle peak.
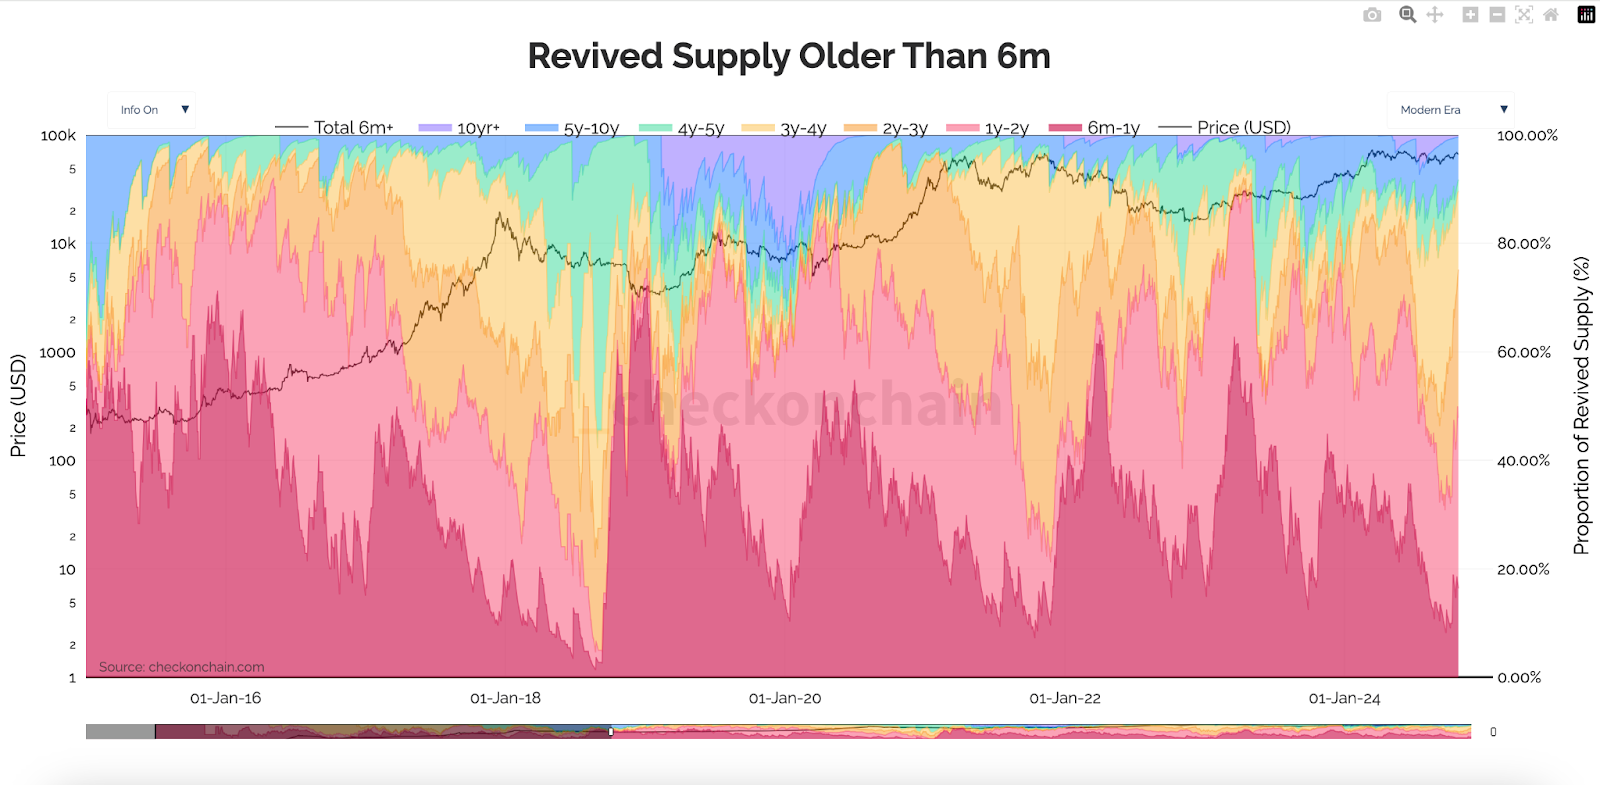
Source: Checkonchain
Short-term holders gain momentum
Long-term holders (LTH) have added around 1,000,000 BTC over the past three months, either through accumulation or by transitioning to LTH status, and now control over 70% of Bitcoin’s supply. However, over the last two weeks, short-term holders (STH) have been increasing their share of the supply, potentially signaling an upward move. Historically, STH accumulation increases during bull markets (green circles). The current supply distribution between STH and LTH mirrors the 2013 rally, where rapid price gains were followed by a 10-month consolidation before another rally.
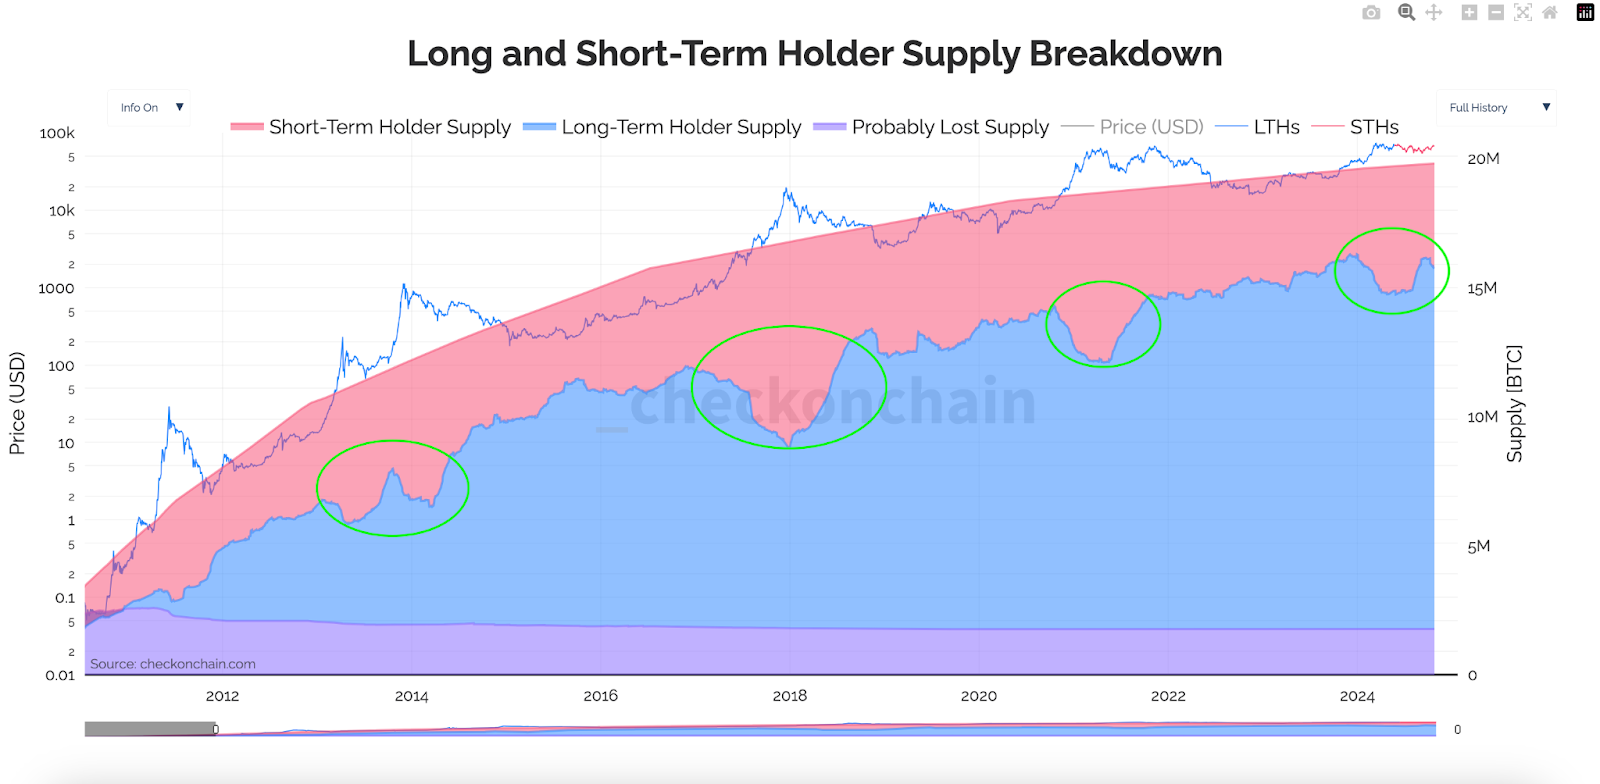
Source: Checkonchain
Conclusion
Bitcoin’s price held largely to our neutral outlook from last week, remaining within a narrow range. This week could bring heightened volatility, with bears potentially challenging the 200-day SMA. While a rebound is possible, it may be short-lived unless Bitcoin breaks decisively above $70,000, which would likely require a fresh catalyst. Despite near-term uncertainty, the long-term outlook remains bullish, indicating a potential new all-time high could be approaching.
The web content provided by CEX.IO is for educational purposes only. The information and tools provided neither are, nor should be construed as, an offer, or a solicitation of an offer, or a recommendation, to buy, sell or hold any digital asset or to open a particular account or engage in any specific investment strategy. Digital asset markets are highly volatile and can lead to loss of funds.
The availability of the products, features, and services on the CEX.IO platform is subject to jurisdictional limitations. To understand what products and services are available in your region, please see our list of supported countries and territories. This page includes additional links to information about individual products, and their accessibility.

You can get bonuses upto $100 FREE BONUS when you:
💰 Install these recommended apps:
💲 SocialGood - 100% Crypto Back on Everyday Shopping
💲 xPortal - The DeFi For The Next Billion
💲 CryptoTab Browser - Lightweight, fast, and ready to mine!
💰 Register on these recommended exchanges:
🟡 Binance🟡 Bitfinex🟡 Bitmart🟡 Bittrex🟡 Bitget
🟡 CoinEx🟡 Crypto.com🟡 Gate.io🟡 Huobi🟡 Kucoin.


Comments