This weekly piece of cryptocurrency price analysis and thought leadership is brought to you by the expert team at CEX.IO, your crypto guide since 2013. We’re committed to helping users maximize their understanding of price movements happening across the crypto ecosystem, all from a single resource.&
In this edition, we discuss how the S&P 500 stock index’s next big move could determine whether Bitcoin creates a new capitulation low or starts a potential uptrend. In the 34th edition of our Crypto Ecosystem Update, we also note two critical on-chain factors brewing for Bitcoin.
Plus, enjoy detailed price analysis for XRP, Lido, and Cardano in light of their recent developments.&
Read along for in-depth breakdowns and enjoy reviews of correlated markets to help you make the most informed decisions along your crypto journey.
S&P 500 could seal Bitcoin’s fate
This week, the S&P 500 stock index could trigger a major move in Bitcoin.&
Following the release of the nonfarm payroll data on October 7, which showed that employers hired more workers in September than expected, the S&P got rejected at the rising channel resistance from summer 2022 and closed the day with a 3% loss.
It’s likely that these robust employment figures triggered the selloff, as they could encourage the Federal Reserve to explore more aggressive rate hikes in the future as it attempts to cool down the economy.
The S&P 500 was earlier rejected at the major falling resistance line on March 30 and August 17, which revealed a descending resistance from the January 4 all-time high (see the chart below). Then on September 22, the index lost the rising channel that it had followed since the June 16 low.
S&P 500 price chart with the resistance lines. Source: Tradingview.
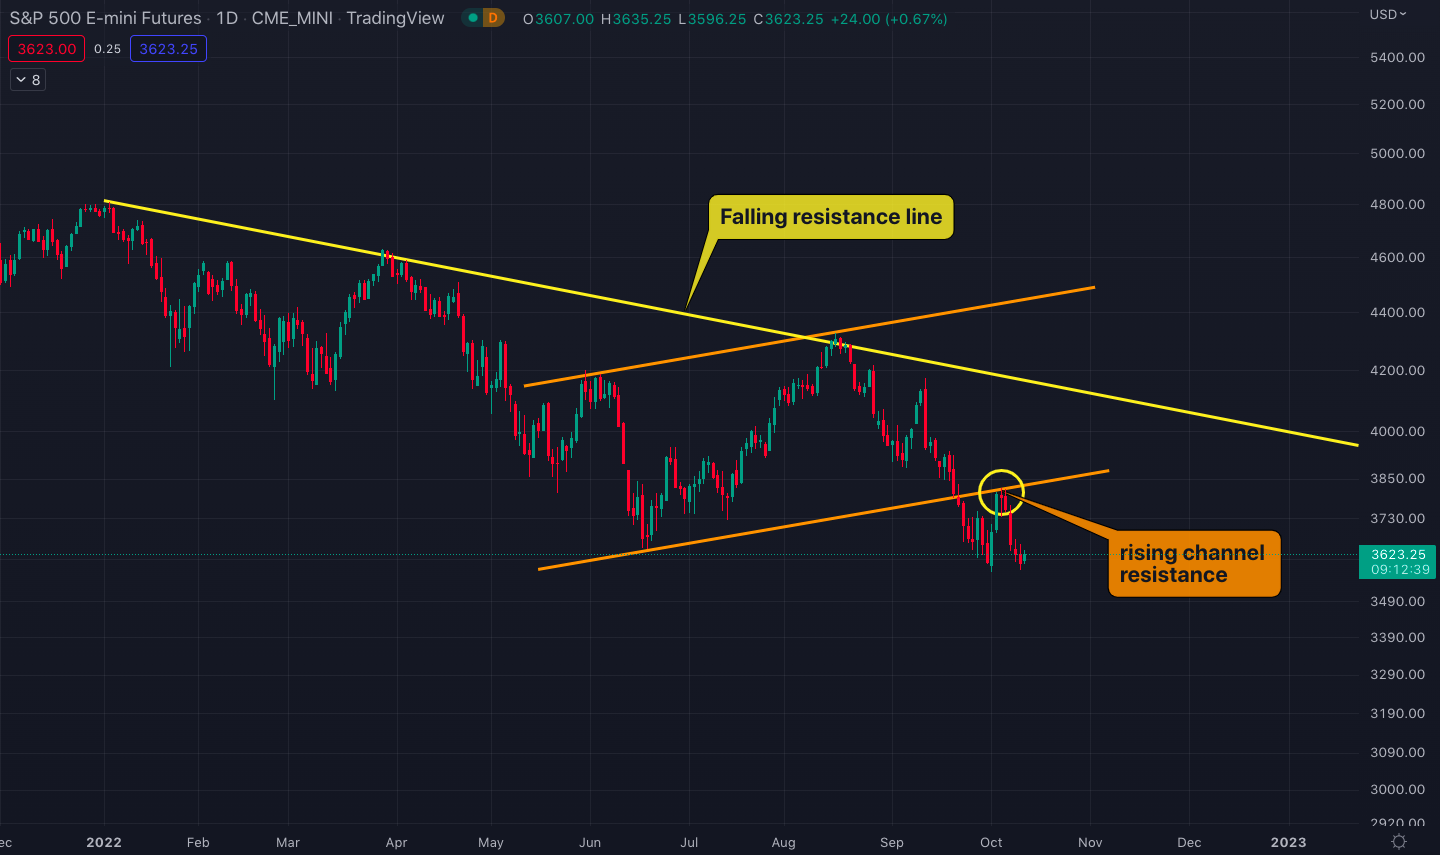
On October 5, the bounce from the two previous trading days was rejected at the rising channel resistance (see the image above). If the S&P 500 index fails to climb back into the channel soon, a dramatic selloff could follow later this week to significantly lower price levels.&
A crash in the S&P could cause Bitcoin to finally capitulate below its June 18 low at $17,600.
However, it is possible that a new low in Bitcoin could play out as a bear trap, and result in a final shakeout before a large uptrend. If that scenario plays out, it is possible for Bitcoin to temporarily drop to the $16,200 support and leave behind traders waiting to buy at $12,000, a level that constitutes historical monthly support (see the chart below).&
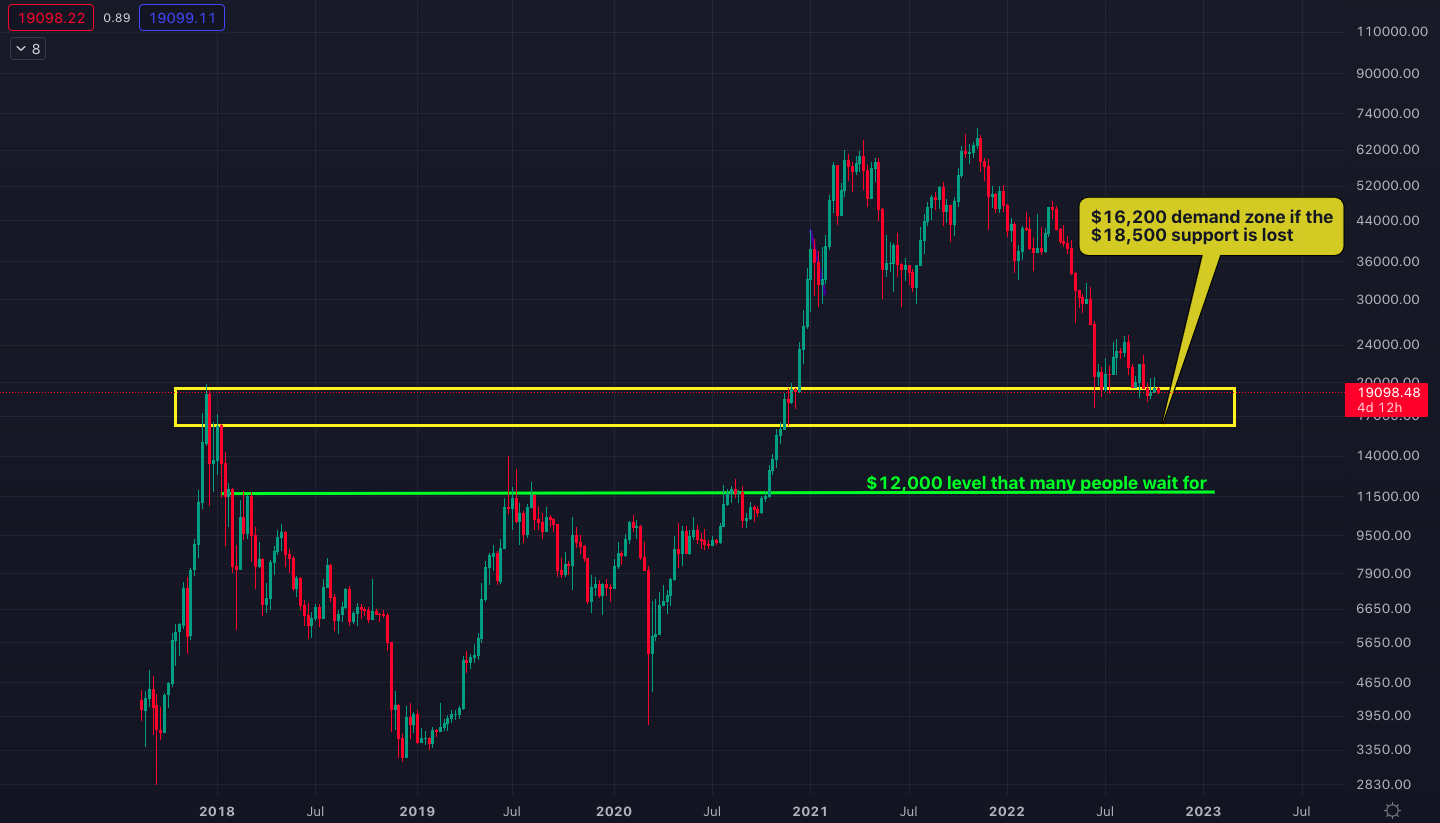
Bitcoin/U.S. dollar price chart on a weekly scale.
The September consumer price index (CPI) announcement on October 13 could determine the S&P’s next direction, and whether Bitcoin drops to $16,200 or directly starts an uptrend from the current $19,000 region.
Bitcoin volatility index hints at an explosive move
The Bitcoin volatility index has dropped to a new all-time low, below the historical 1% support level (circled in red in the chart below). This indicates that a massive price move could be imminent in the near future.&
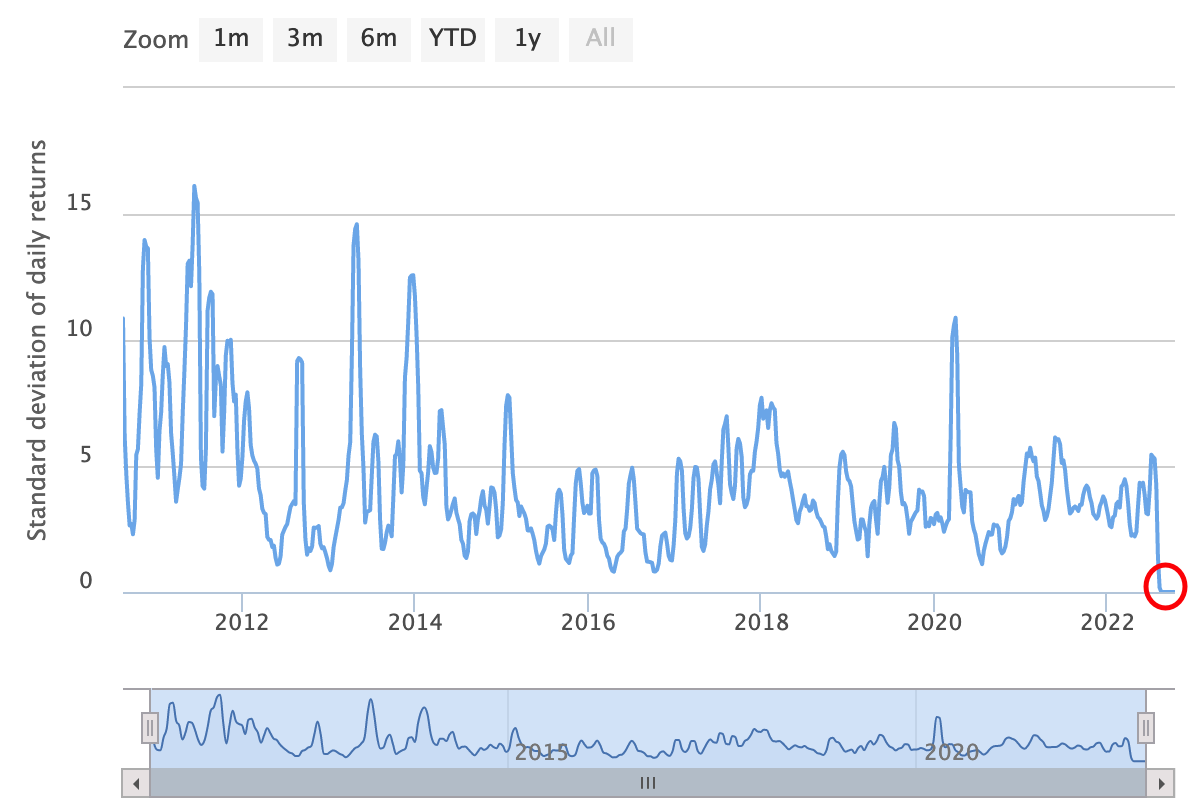
Bitcoin volatility index chart hitting zero recently. Source: Buy Bitcoin Worldwide.
In the past, whenever the volatility index dropped to such historic lows, the price of Bitcoin typically made a sudden and extreme move. Some notable instances include:
- The crash from $6,000 to $3,000 in November and December of 2018 when the volatility index dropped to 1.42% in October 2018.&
- The relief rally in 2019 from $4,000 to $14,000 when the index dropped to 1.42% again.
- The last bull run from $10,000 to $65,000 when the index dropped to 1.11% in July 2020.&
Currently, the volatility index is way below the above samples which could suggest that we are past due for an explosive price movement.
Coin-days destroyed indicates a supply shortage
Bitcoin’s 90-day coin days destroyed (CDD-90) metric has recently reached an all-time low (circled in red in the chart below). CDD-90 measures the number of coin days that have been destroyed over a 90-day period, which helps market participants visualize durations of higher and lower coin holding.
Having BTC’s CDD-90 reach an all-time low indicates that holding bitcoin is currently the dominant behavior playing out in the market. In turn, this could result in a supply shortage down the road if the price continues to bottom out.
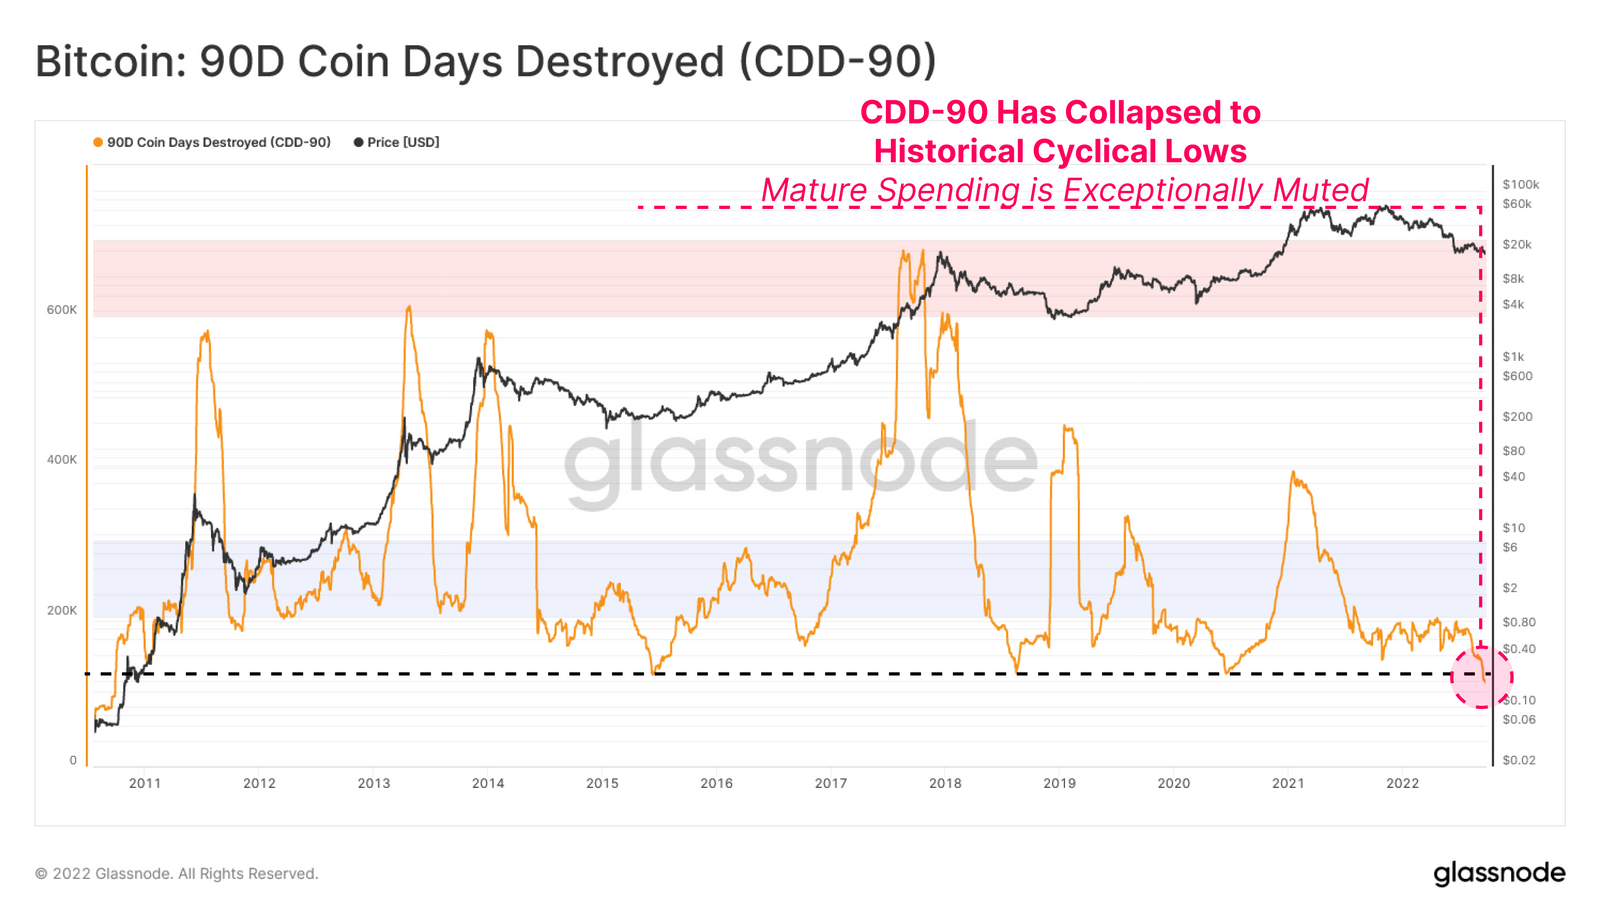
CDD-90 chart with the recent all-time low. Source: Glassnode.
XRP rejected at the $0.55 double top
Despite the recent positive stimulus from its endless SEC lawsuit, XRP was rejected at $0.55 again on October 9. The sudden but truncated move that day from $0.50 to $0.55 ended up as a bull trap, which could turn $0.55 into a double top reversal formation (see the chart below).

XRP/U.S. dollar chart showing the bull trap at $0.55.&
XRP/U.S. dollar chart with the double top.
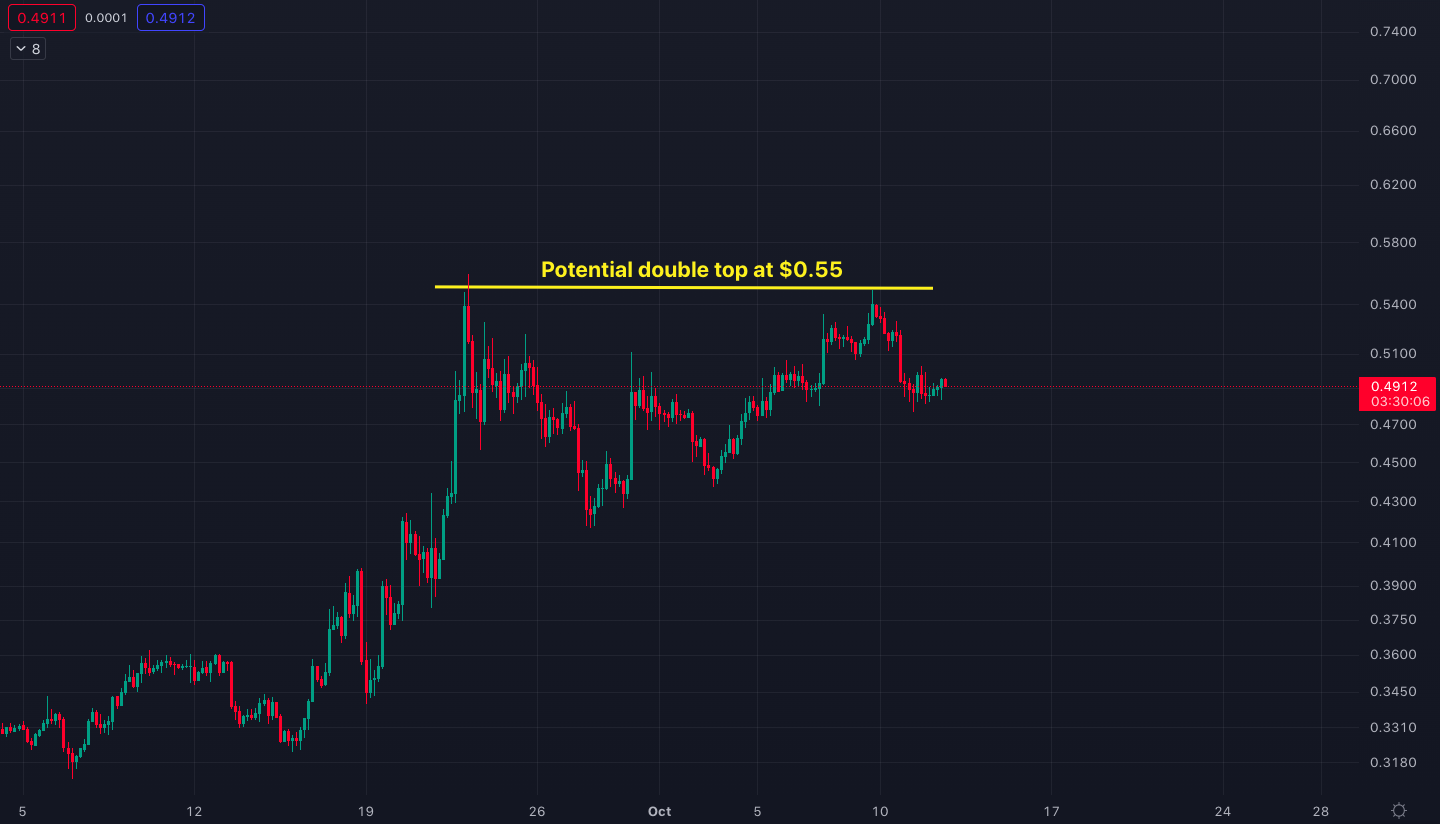
A double top in XRP, coupled with a crash in Bitcoin, could take the price of the token to levels lower than the $0.42 bottom on September 28.
In addition, the XRP/USD chart indicates the price could be printing a head and shoulders pattern, which is a topping formation that often precedes a downtrend.
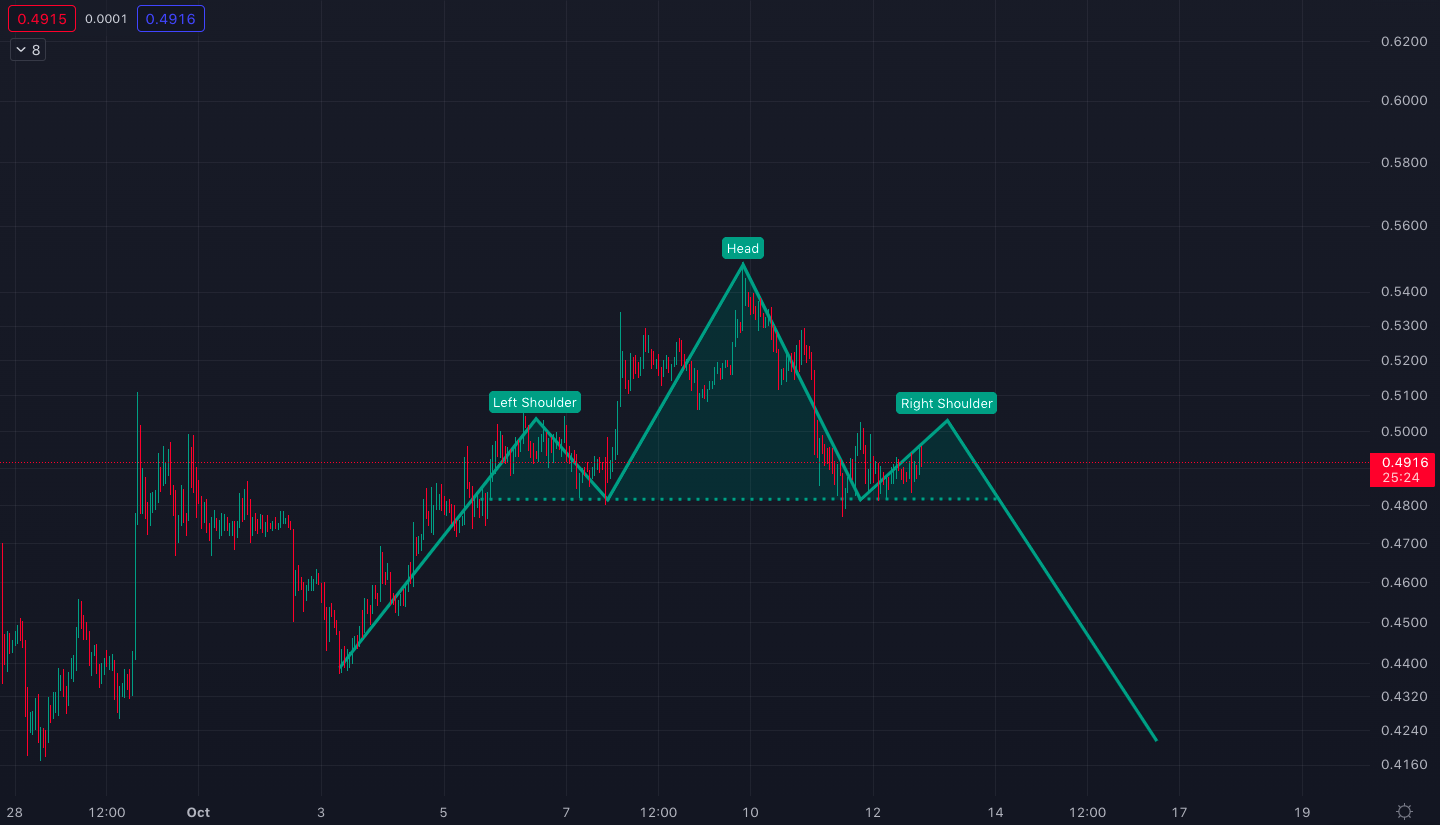
Possible head and shoulders formation on the XRP/USD chart.
However, if the price of Bitcoin remains flat or moves upside in the next few days, XRP could quickly march to its $0.80 resistance, and potentially give its holders a more than 50% return from the current price level.
Lido integrates Arbitrum and Optimism
Lido Finance recently launched on Arbitrum and Optimism, two of the most popular layer 2 networks in an effort to reduce gas fees for users who stake Ethereum via Lido.
Lido provides liquid staking, which allows more flexibility for stakers as they can withdraw their funds at any time as opposed to locking up value on the Ethereum network.&
Crypto ecosystem leaders have commented that the staking cannot grow much further as an industry unless the issue of asset lock-up can be solved.
According to its website, Lido currently holds $5.7 billion worth of staked ETH representing around 40% of total Ethereum staked.
The rapid growth of the Lido ecosystem has resulted in an explosive price move in its native token, $LDO. Following the crypto market bottom on June 18, the price of LDO has exploded by 640%, from $0.40 on June 30 to $3.10 on August 14 (see the chart below).
Since the $3.10 top, the price has retraced significantly to a low of $1.27, which is now critical support (the orange horizontal line in the chart below).&
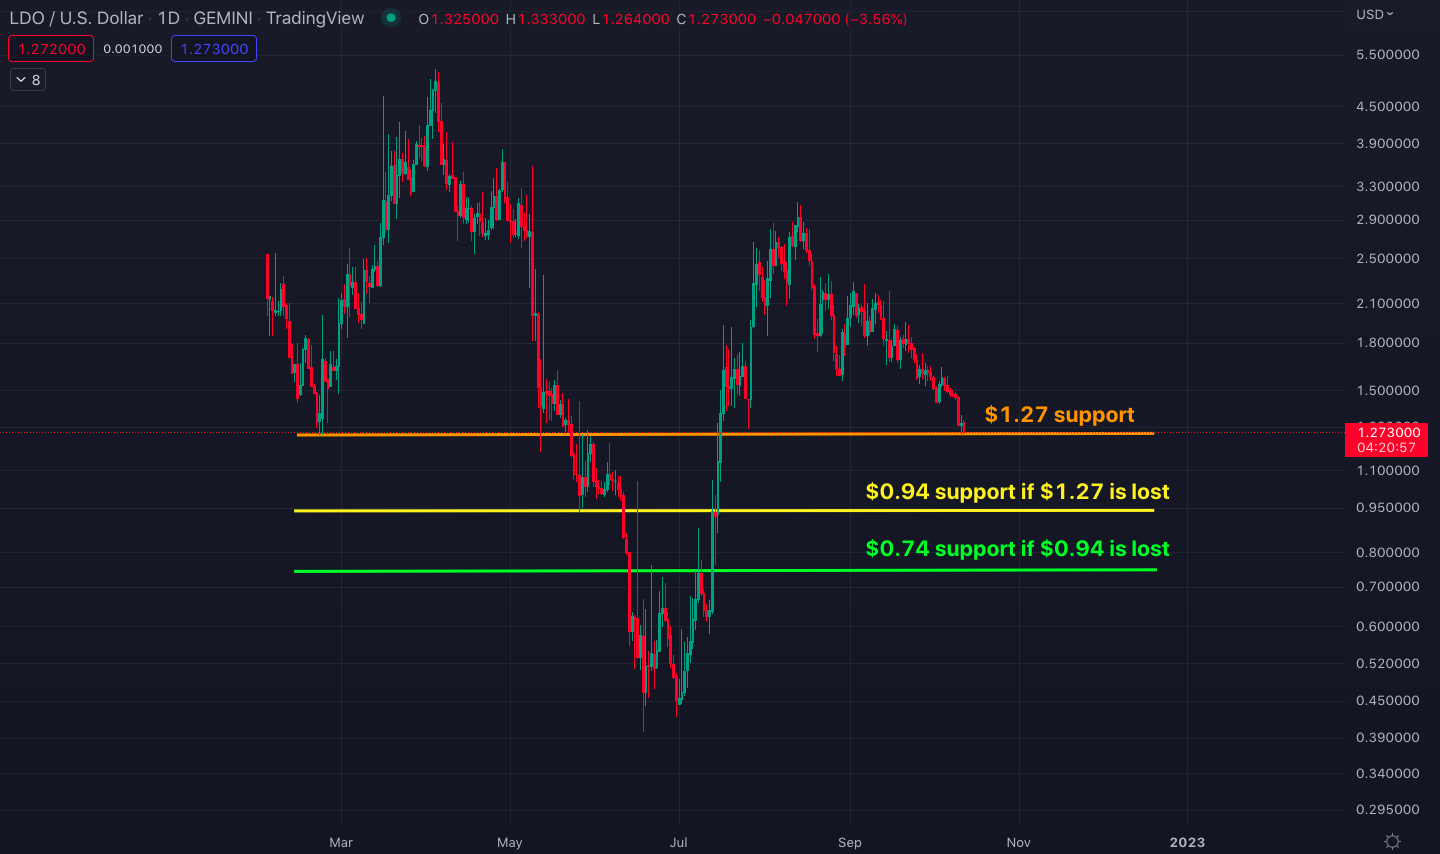
LDO/U.S. dollar price chart with the critical support levels.
Although the Arbitrum and Optimism launches can act as positive catalysts for LDO, the next support level is significantly below the current price if $1.27 is lost.&
Should $1.27 be lost on a daily close, a quick drop to $0.94 or $0.74 levels could follow.&
On the flip side, if the $1.27 support is preserved, there could be a massive inverse head and shoulders pattern emerging on the LDO chart, which could take the price to very high levels compared to the previous $3.10 top.
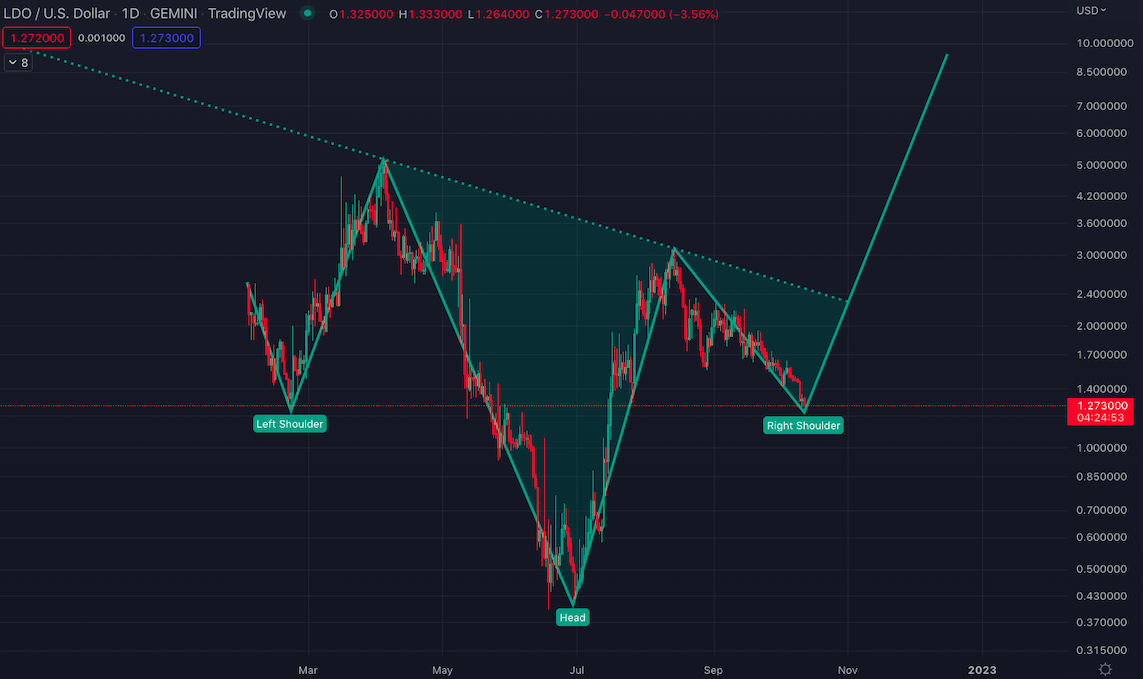
Potential inverse head and shoulders formation on the LDO chart.
Is Cardano running out of steam?&
Although the hard fork on September 22 created much hype for Cardano, along with a number of important launches on its blockchain, none of those developments could trigger the anticipated uptrend for its native token, $ADA.
In fact, ADA has moved inside a large descending triangle after bottoming one month earlier than the rest of the market on May 12. Just recently it started to break down from that triangle.
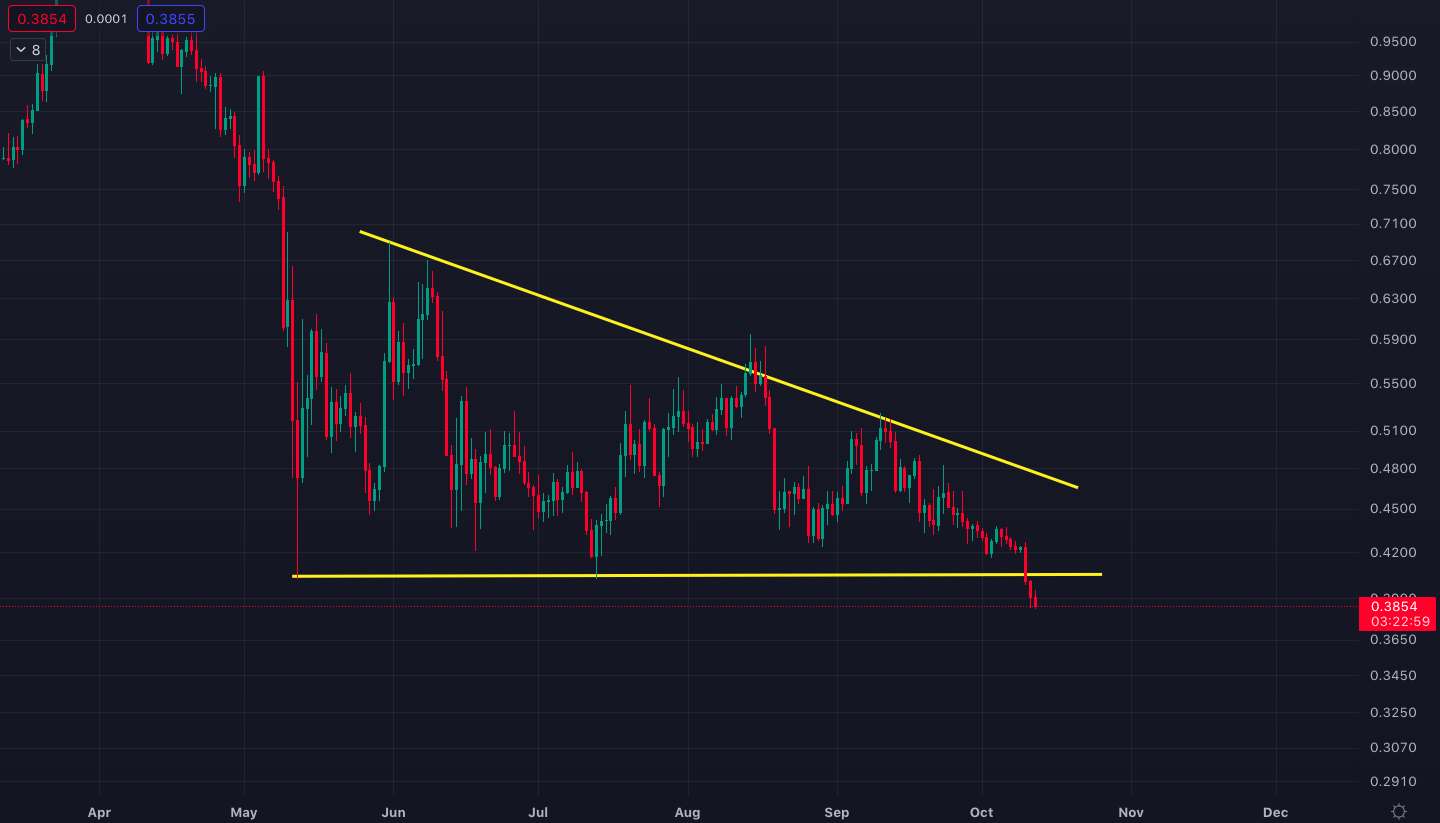
ADA/USD breaking down from the descending triangle.
Descending triangles are typically consolidation periods during macro downtrends, which usually continue with a further leg to the downside. So it should come as no surprise if the breakdown from the triangle is sustained.&
Price targets for descending triangle breakdowns are usually estimated by taking the length of the triangle’s base and extrapolating it from the breakdown point. In that case, the breakdown from ADA’s descending triangle would have a price target of $0.30 (see the chart below).&

$0.24 target for Cardano if the descending triangle breaks down.
Tune in next week, and every week, for the latest CEX.IO crypto ecosystem update. For more information, head over to the Exchange to check current prices, or stop by CEX.IO University to continue expanding your crypto knowledge.
Disclaimer: Information provided by CEX.IO is not intended to be, nor should it be construed as financial, tax or legal advice. The risk of loss in trading or holding digital assets can be substantial. You should carefully consider whether interacting with, holding, or trading digital assets is suitable for you in light of the risk involved and your financial condition. You should take into consideration your level of experience and seek independent advice if necessary regarding your specific circumstances. CEX.IO is not engaged in the offer, sale, or trading of securities. Please refer to the Terms of Use for more details.

You can get bonuses upto $100 FREE BONUS when you:
💰 Install these recommended apps:
💲 SocialGood - 100% Crypto Back on Everyday Shopping
💲 xPortal - The DeFi For The Next Billion
💲 CryptoTab Browser - Lightweight, fast, and ready to mine!
💰 Register on these recommended exchanges:
🟡 Binance🟡 Bitfinex🟡 Bitmart🟡 Bittrex🟡 Bitget
🟡 CoinEx🟡 Crypto.com🟡 Gate.io🟡 Huobi🟡 Kucoin.


Comments