There was turmoil and uncertainty in all financial markets during February and March due to the erupted war. Fears about aggressive federal rate hikes and an economic recession swooped the world.
The cryptocurrency market took a dive with sell-offs across all coins, but Bitcoin consistently managed to make its 600-day simple moving average (SMA) support and bounced from the $35,000-$38,000 levels at every dip. After an almost two-month accumulation period around the 600-day SMA, Bitcoin started moving upwards on March 14 and hit its 200-day SMA resistance at $48,200 on March 28. This brought relief rallies across the board where some cryptocurrencies gave over 2x returns.
Although charts show some dangers brewing for Bitcoin in the long run, short-term momentum is quite bullish now for the cryptocurrency market to make a new leg upwards.
In this week’s crypto ecosystem update, we scrutinize the short and long term outlook for Bitcoin and Ethereum, in terms of their on-chain activity and technical analysis. Additionally we review some major crypto industry updates.
BITCOIN ANALYSIS
Price Overview
- Last 7-day change: -4.46%
- 7-day low: $42,830.50
- 7-day high: $47,419.60
- Last 30-day change: 12.26%
- 30-day low: $37,664.30
- 30-day high: $48,194.80
Network Overview
- Blocks Mined (7-day): 1,006 blocks
- Average Block Interval (7-day): 603.35 seconds
- Coins Discovered (7-day): 6,287.5 BTC
- TX Count (7-day): 1.85 million
- TX Volume (7-day): 33.5 million BTC
- Net Change in Exchange Balance (7-day): -2,634.14 BTC
- On-Chain Activity:
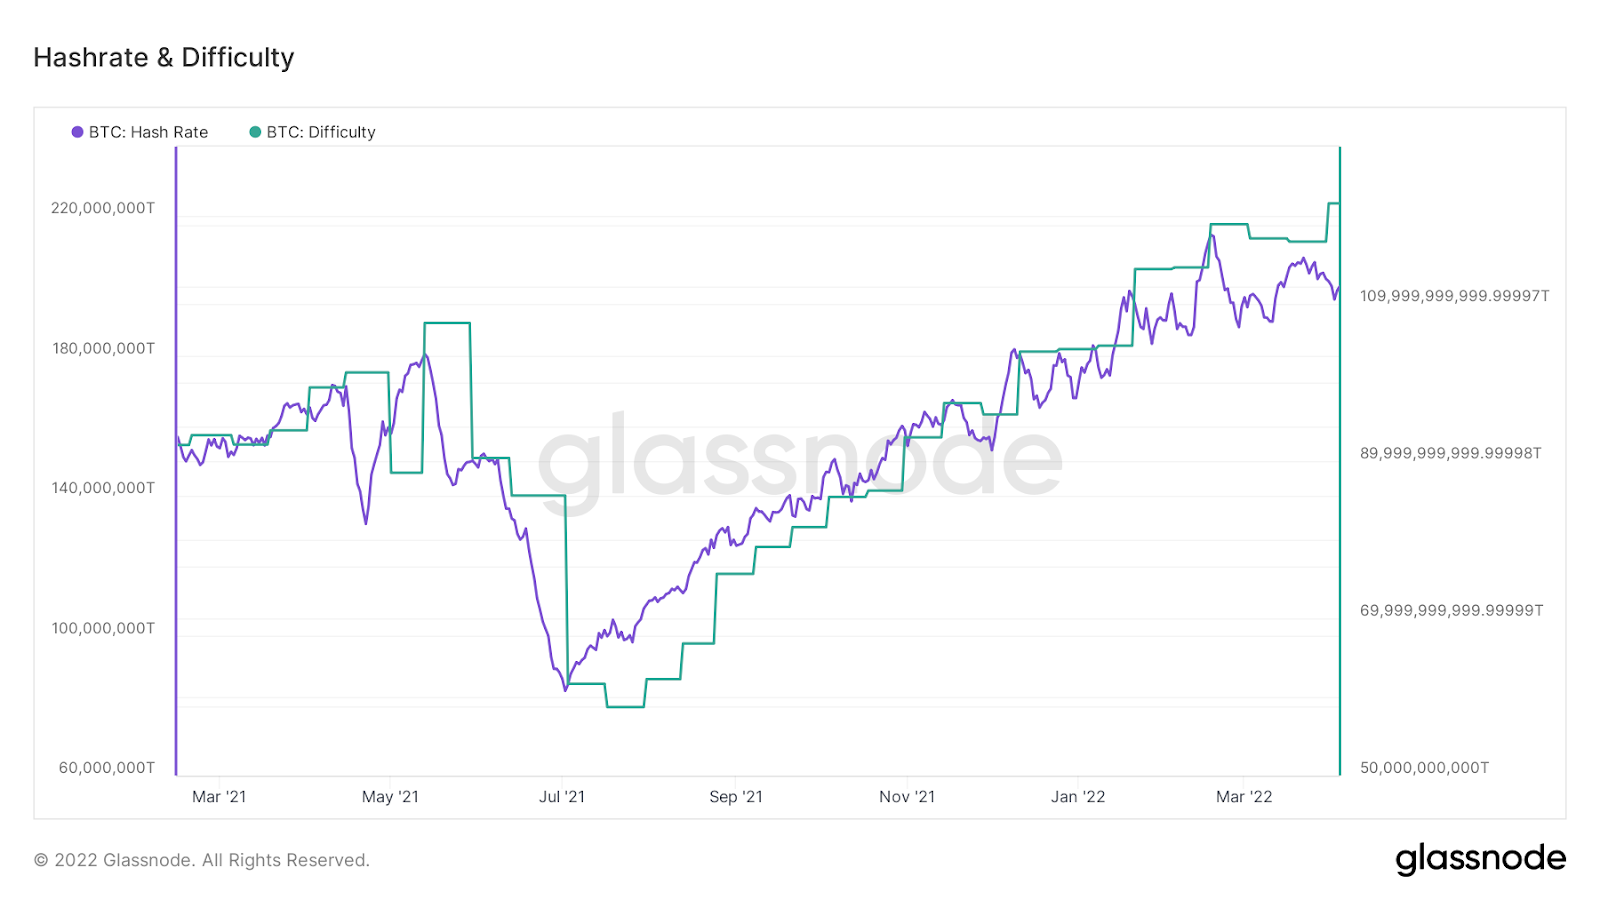
The current on-chain holder activity closely resembles Fall 2020 when Bitcoin’s price was at $10,000. At the moment, Bitcoin’s supply side is tighteningwith miners and long-term hodlers accumulating coins at steady paces. Mining difficulty reached a new all-time high following a sharp increase of 4% on March 31 while the hash rate sits within 10% of the all-time high figure reached in February.
Additionally, positive regulatory developments, the continuous accumulation of both new and old whales, and possible new fundamental developments are bolstering the market sentiment for Bitcoin.
Despite recording a slight loss, Bitcoin has outperformed all major U.S. stock indexes in the first quarter of 2022:
Q1 2022 Performances
- Bitcoin: -1.54% (Open: $46,223.43 / Close: $45,513.60)
- S&P 500: -5.18% (Open: 4,778.14 / Close: 4,530.42)
- Nasdaq: -9.5% (Open: 16,395.51 / Close: 14,838.49)
- Russel 2000: -7.86% (Open: 2,246.71 / Close: 2,070.13)
- Dow Jones Industrial Average: -4.52% (Open: 36,321.59 / Close: 34,678.36)
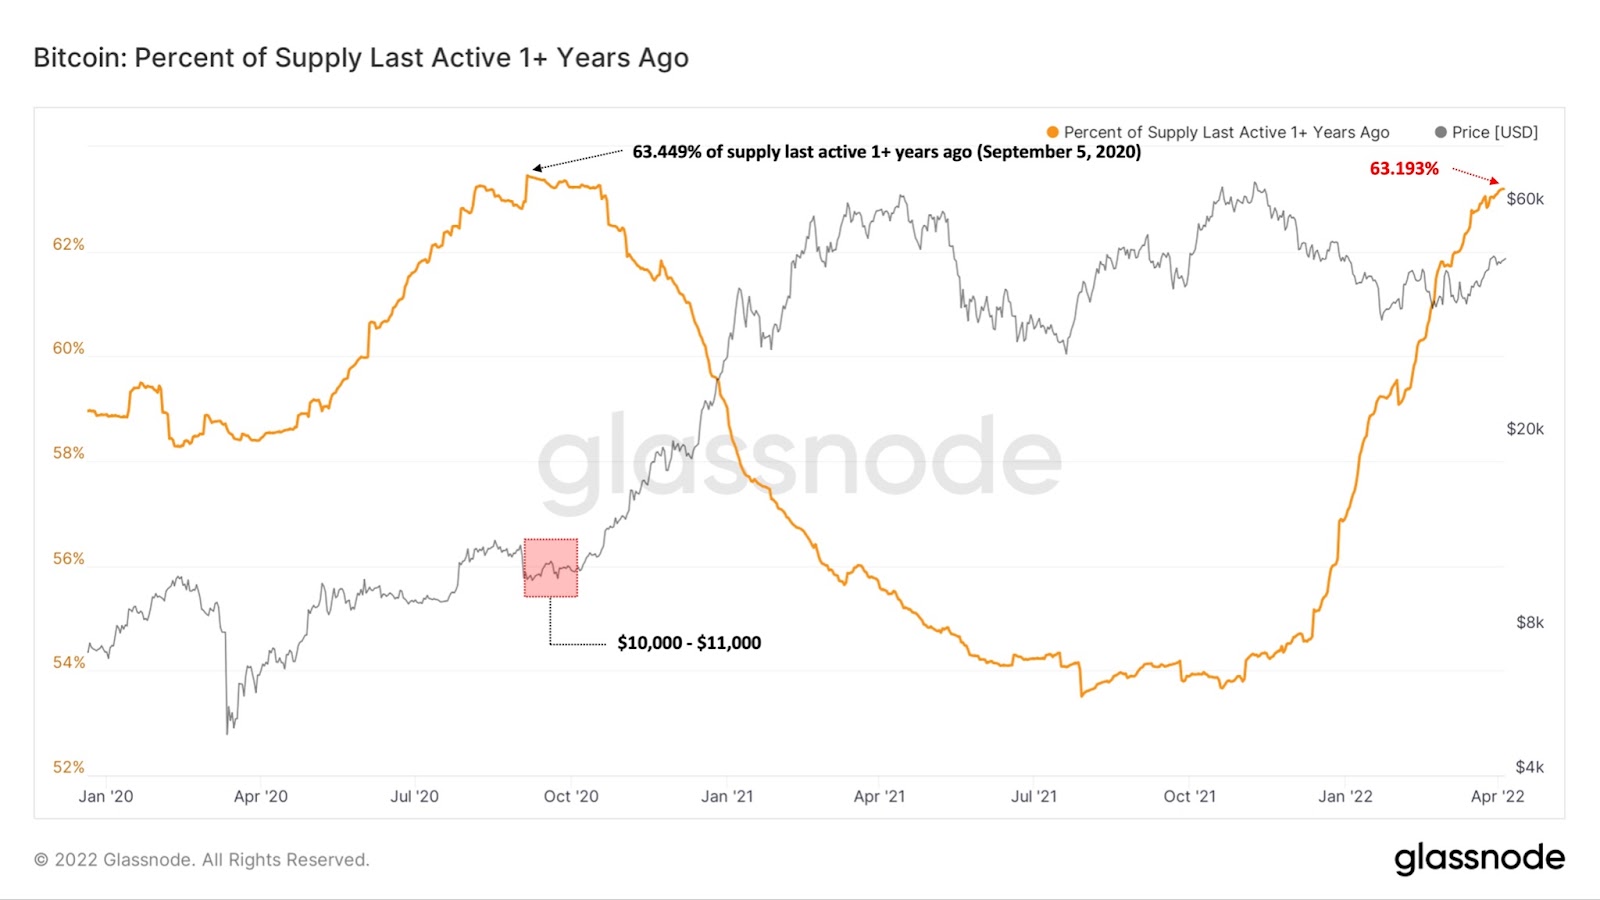
- Hodler Behavior
Bitcoin supply that has not been spent in over one year is fast approaching the all-time high of 63.4%. This score was recorded in September 2020 as you can observe in the below chart when Bitcoin was trading at around $10,000.
There has been very little spending on coins older than a year since November 2021 when BTC was trading at around its all-time high price of $69,000. The growth in the ratio of supply last moved over one year ago suggests that holders do not care about the ongoing uncertainty across financial markets. The amount of Bitcoin supply that grows in the hands of this demographic is a positive sign that longer-term holders are targeting new all-time high prices.
Moving forward, the release of these coins are a key indicator to watch for a leg higher, which will indicate that longer-term holders are distributing their hodled coins to new market entrants.
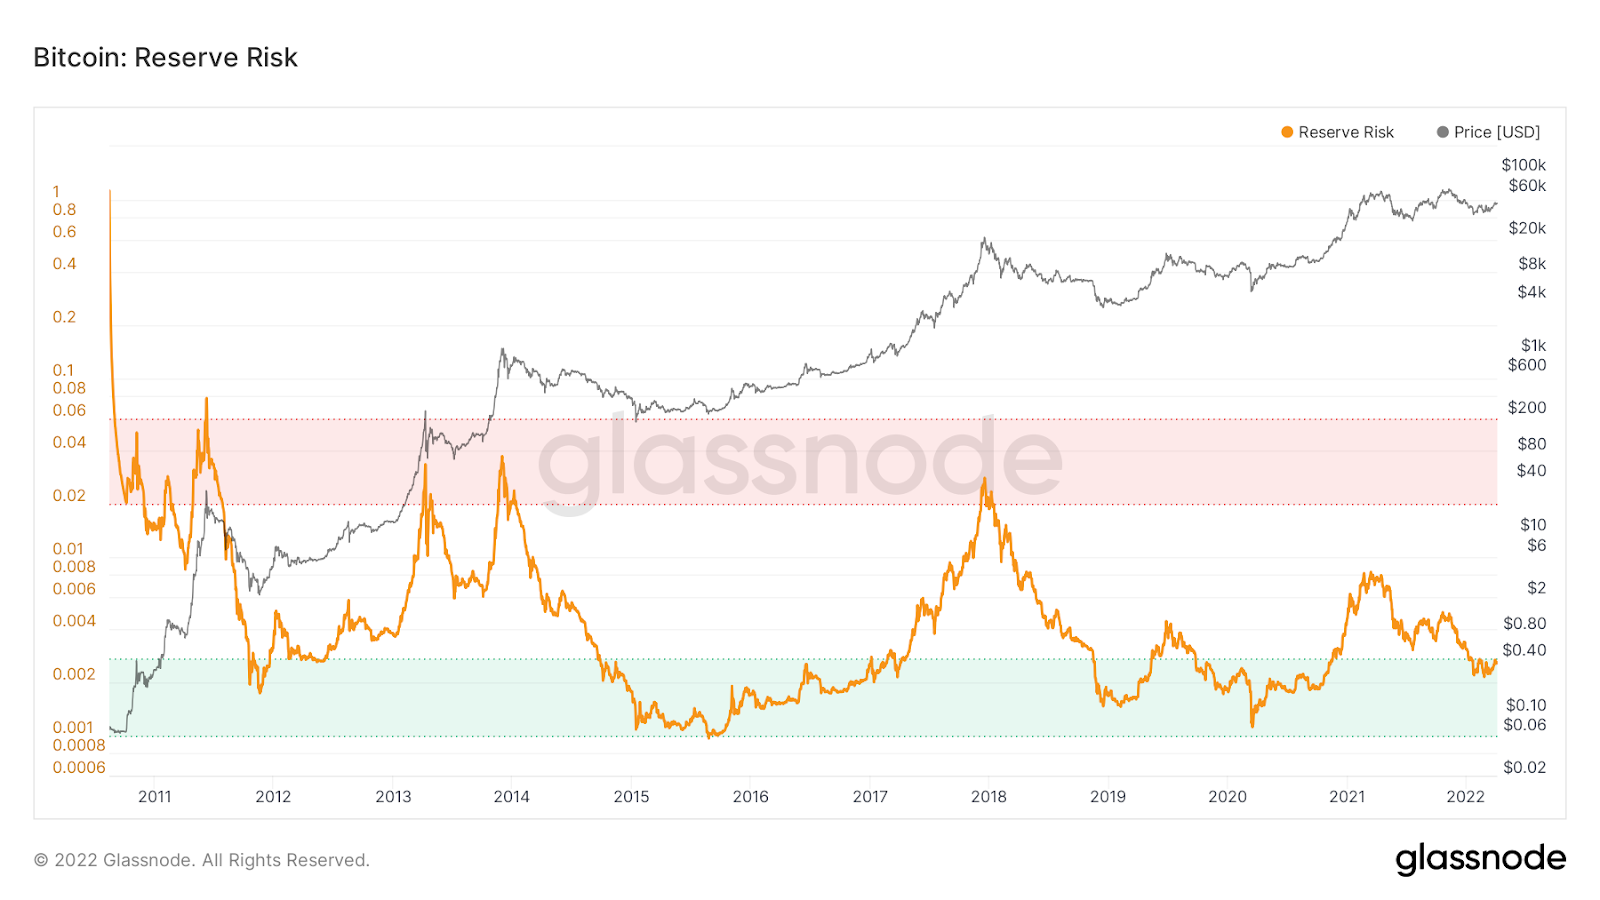
Reserve risk also confirms that the confidence level of long-term holders is at historical highs. Reserve risk is a measure of long-term holder conviction relative to the market price of Bitcoin. Long-term holder confidence is high when the reserve risk is low (green section). This metric indicates that holders had a high level of confidence since the middle of January 2022. Bitcoin was trending at $40,000 at this time.
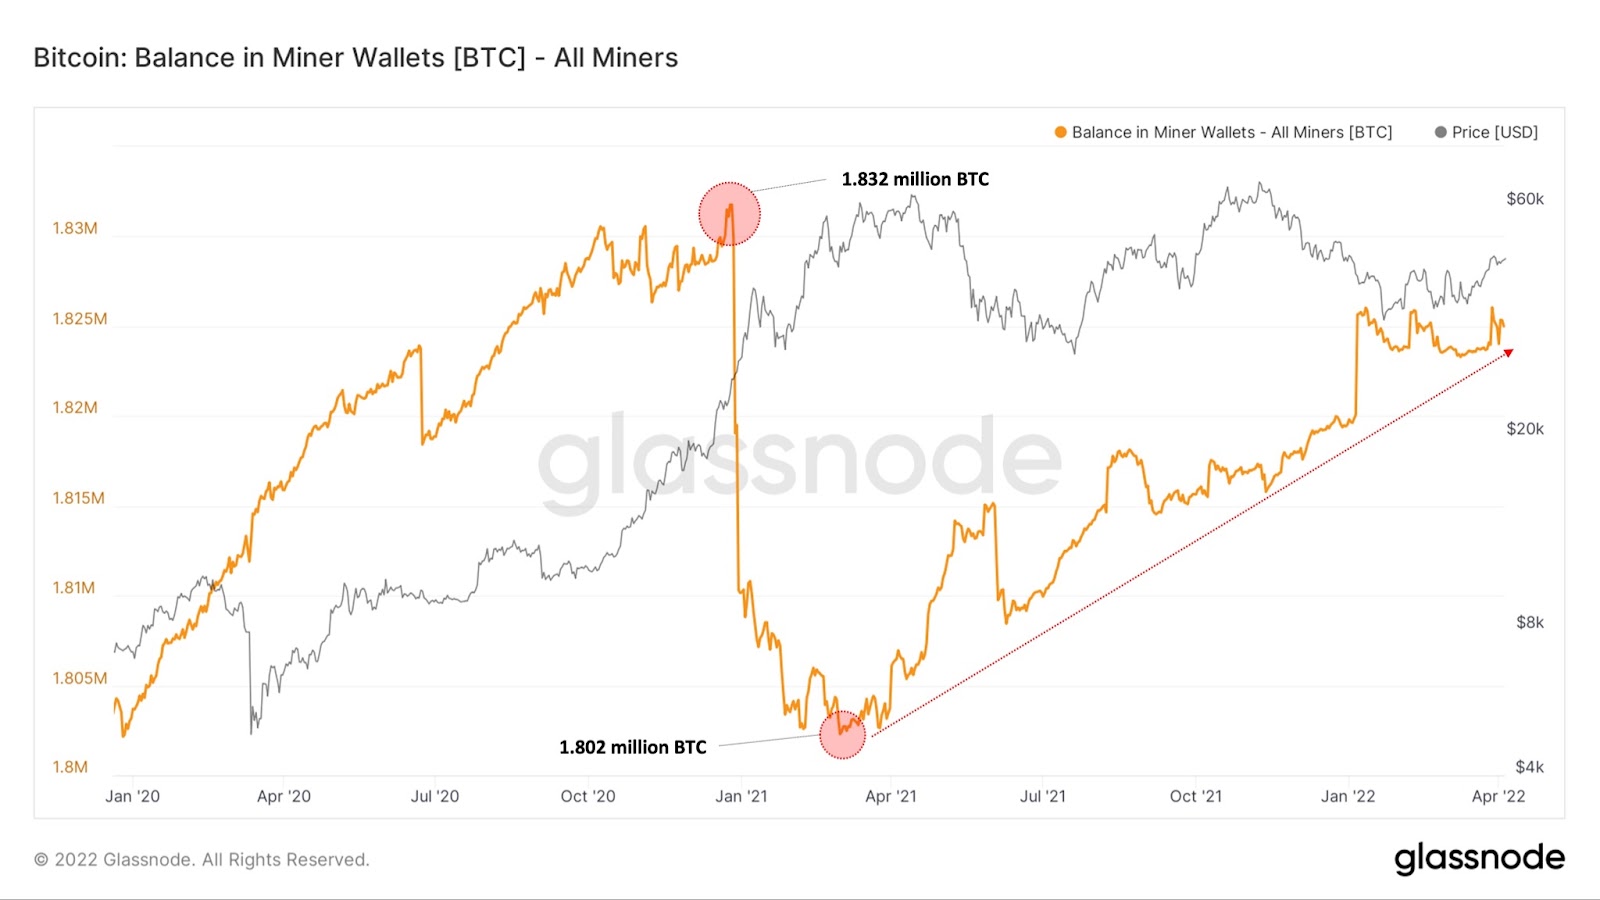
Miners are unwilling to sell their coin rewards. The balance held by Bitcoin miners has increased by around 23,000 BTC since reaching the local bottom on March 01, 2021. About 360,000 BTC have been discovered by miners since then, which means they have hodled about 6.4% of all the coins they earned cumulatively. Following the big miner immigration due to China bans, access to western capital markets has allowed miners to continue and expand their mining operations. This in return allowed them to hodl some portion of the coins they mined.
Debt and equity raises have been leveraged by miners to grow their programs. Most notably, Genesis Digital raised $431 million in September 2021 to add hash, and Marathon raised $500 million in debt in November 2021 to add more BTC to their balance and grow their operation. More recently, Blockmetrix, a Bitcoin mining startup based in Dallas, raised a $43 million Series B round in March.
- Mining
The influx of new capital in the Bitcoin mining sphere has been manifested on-chain over the last number of months. Hash has been hovering around the all-time high set nearly a month and a half agoand difficulty broke out to new highs at the end of March. It is difficult to discover new coins. Hash sits just under 200 million Th/s, which is roughly 10% below the all-time high achieved in mid-February.
Growing competition in Bitcoin mining is positive for the network security, and adds to the scarcity element of BTC. Less BTC is available on a pro-rata basis as more miners join the network, and existing miners expand their operations. The recent developments around miner funding and new mining technology (i.e. intel mining chips) suggest that the trend in mounting competition among miners will continue to grow more intense down the line.
Although Bitcoin’s on-chain activity can foreshadow its future price action, it does not give you any indication about when that activity could be reflected in the price. It could take years for what you see on the chain now to impact the price. Until then, the price of Bitcoin could just head the other direction, leaving you at a significant loss if you take positions based on the on-chain activity only.
If you want to keep an eye on what could happen in between the short and long-term, you can benefit from technical analysis, which we will discuss for Bitcoin in the following section.
- Bitcoin Technical Analysis:
Bitcoin’s technicals show positive signs in the short term. There is favorable momentum as the price fights to turn the $48,000 resistance into support. Upside targets to watch out for in the event of a breakout include $53,000 and $56,000, which are the 2021 bull market resistance levels. Key downside targets to note include $43,000 and $39,000.
Despite the favorable short-term indicators, Bitcoin’s long-term technical view tells a different story:
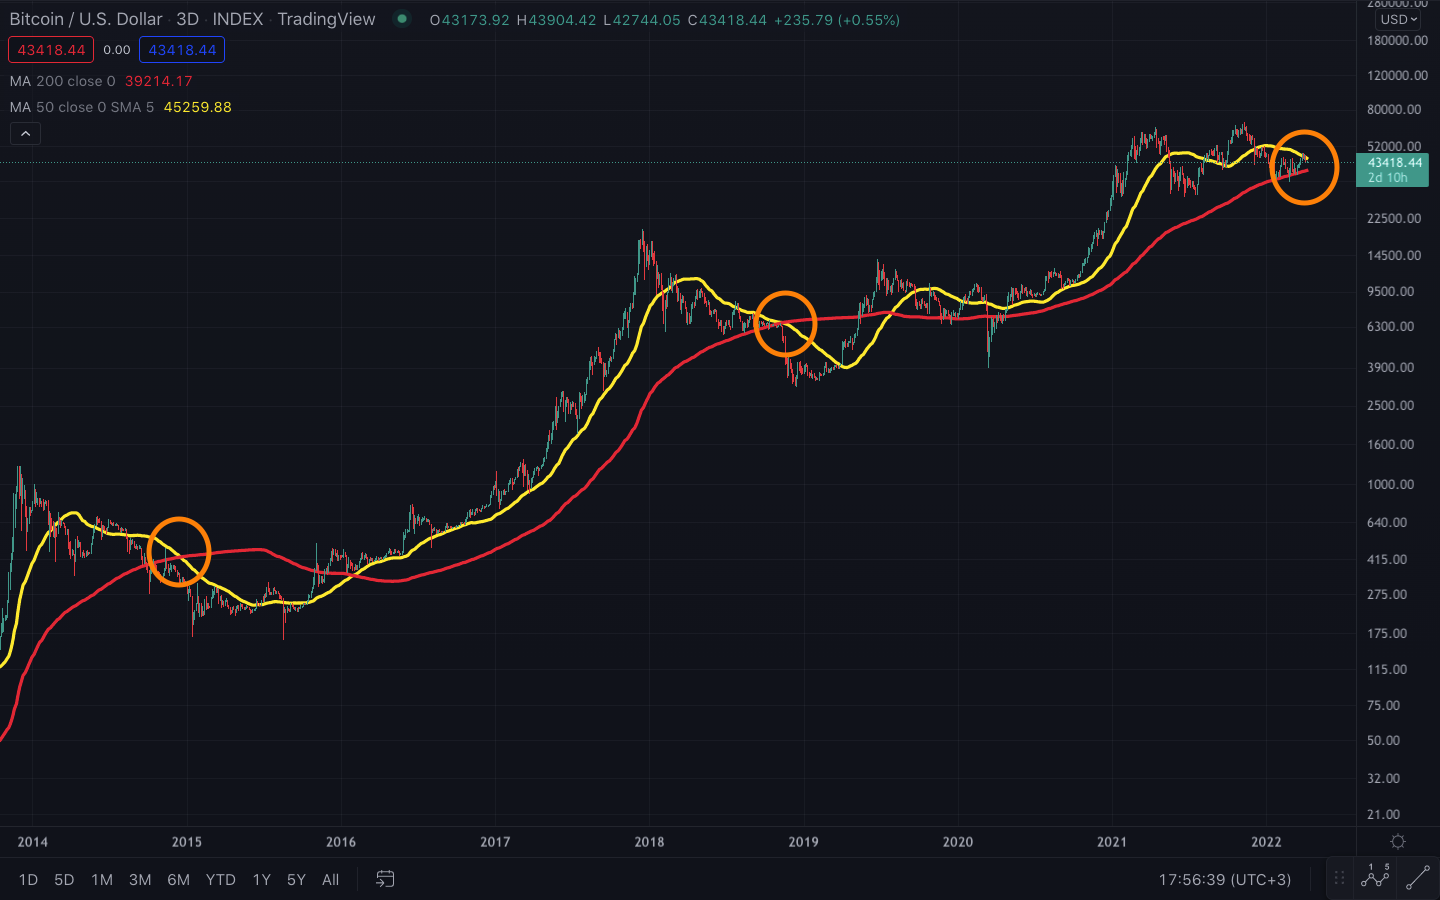
- 200-Day Moving Average
200-day simple moving average (SMA) is a major support and resistance level in any financial market, especially in crypto. It acts as a major borderline to understand whether we are in a bear or bull market. If the price hovers above the 200-day SMA, we are in a bull market. If we remain below then we are on a downtrend in the bigger picture.
Bitcoin fell below the 200-day SMA at the end of last year and consolidated below it throughout January and February. Following the $34,000 bottom on February 24, Bitcoin rallied to the 200 SMA resistance in March, where it hit this resistance line on March 28 at $48,200.
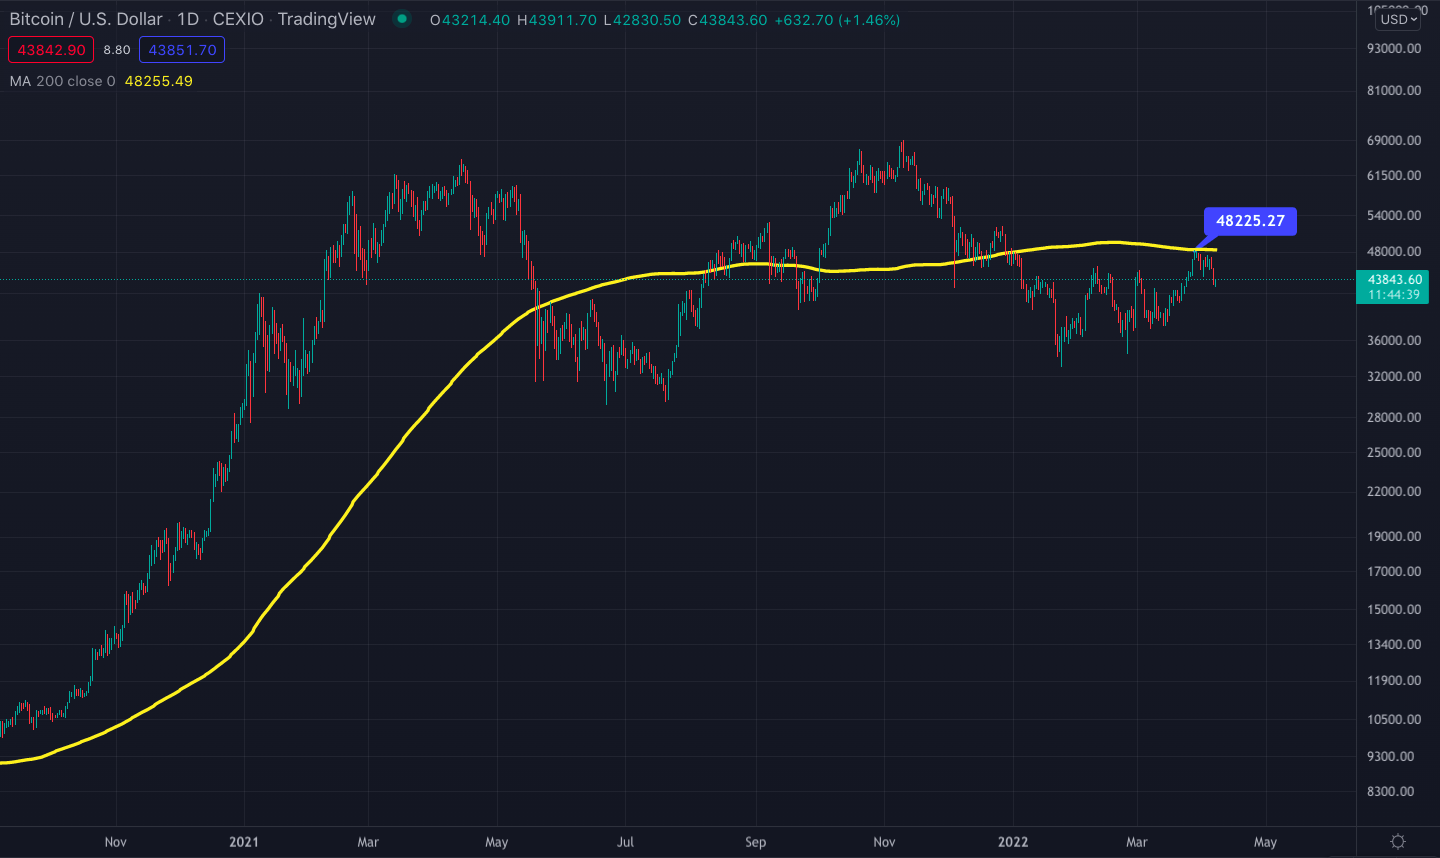
Bitcoin/U.S. Dollar price chart on a daily timeframe. The yellow line represents the 200-day SMA.
Bitcoin price has retraced after hitting the 200 SMA resistance line, to as low as $43,000 on April 6. To continue rallying forward and make a new leg higher, Bitcoin must firmly turn the 100-day SMA line to support (which is the red line in the chart below), and start climbing back again from there. The 100-day SMA is currently at $42,000.
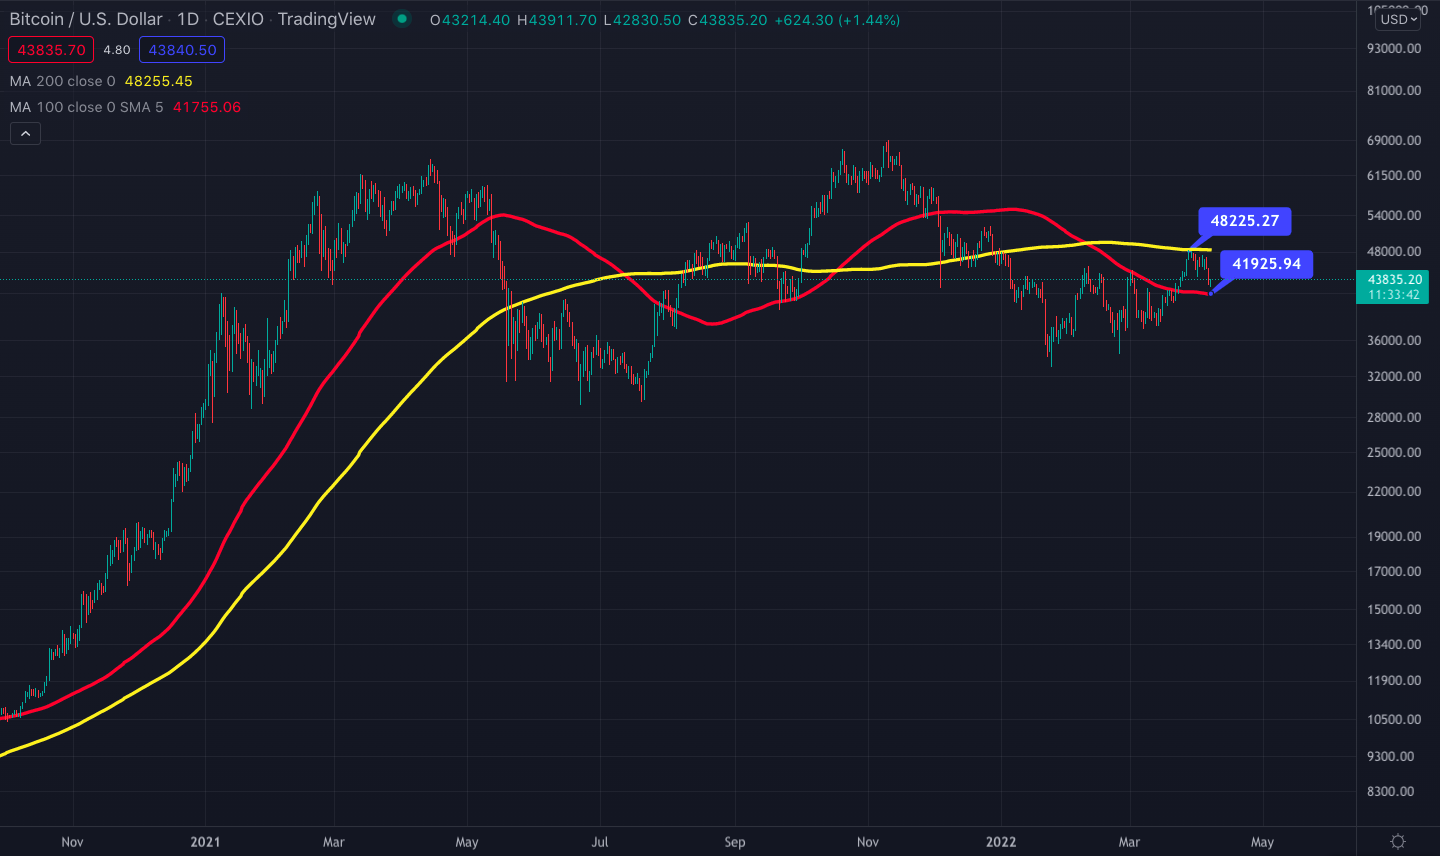
Daily Bitcoin/U.S. Dollar price chart. The yellow line is the 200-day SMA and the red line is the 100-day SMA.
- Weekly MACD
The Moving Average Convergence Divergence (MACD) momentum indicator made a bullish weekly cross on the week of March 28. This was the first time that the weekly MACD turned green since August 2021, which was followed by a rally to a new all-time high price in November at $69,000.
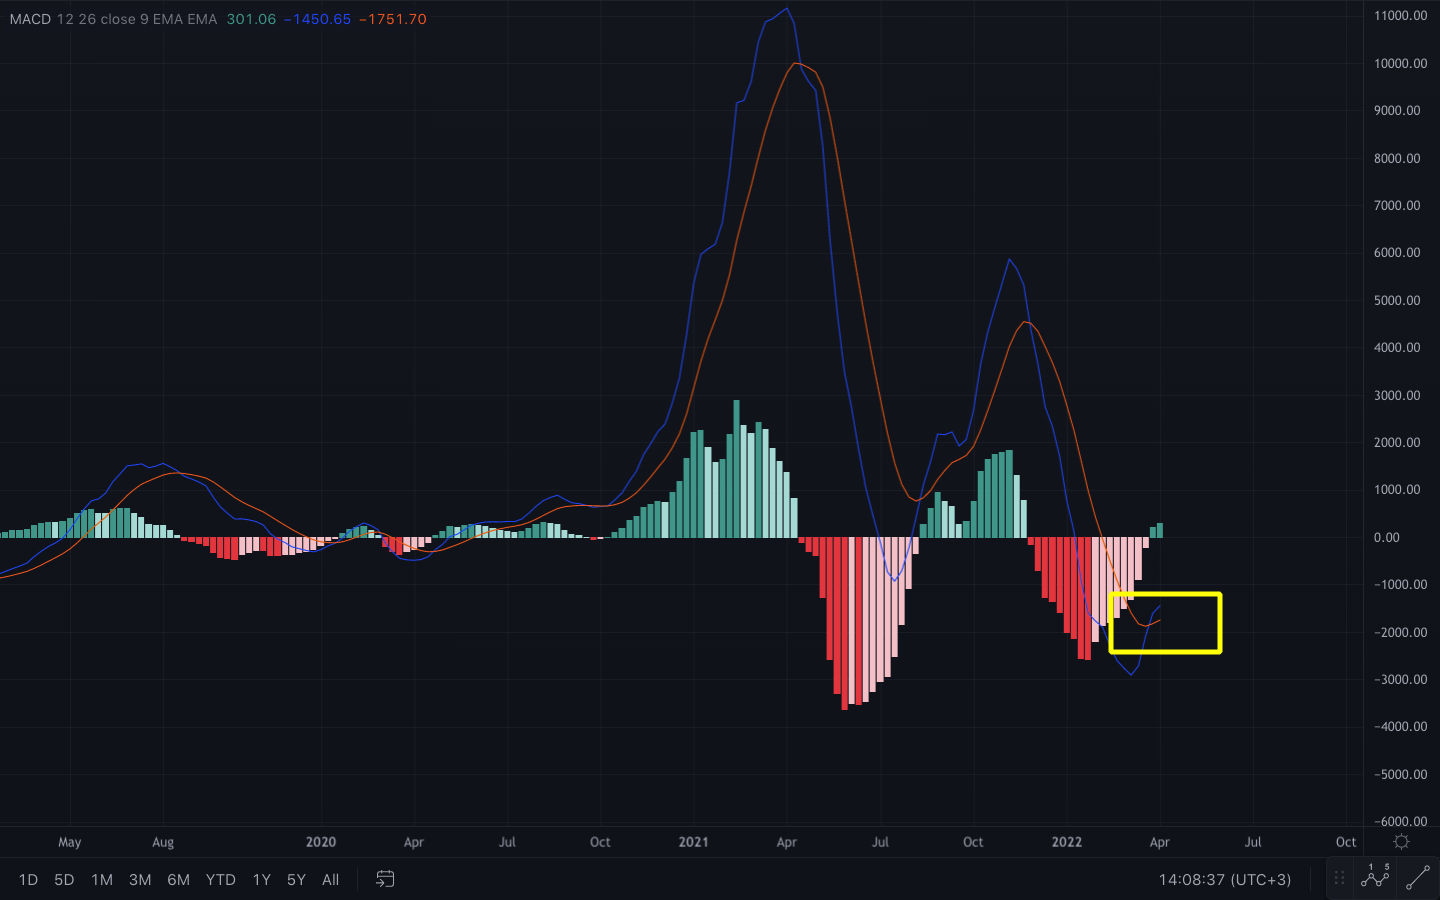
Bitcoin/U.S. Dollar MACD chart on a weekly timeframe
- Weekly Stochastic RSI
Looking at Bitcoin’s weekly stochastic relative strength index (RSI), the indicator has managed to climb above the critical 80 resistance, which is an important ingredient to generating strong price action. There is still room to the upside until the indicator hits the maximum 100 level.
If the weekly stochastic RSI for Bitcoin turns the 80 level to support in the next few weeks, then Bitcoin can find the necessary momentum to climb above $50,000 as the stochastic RSI gets overbought at the 100 level. There is usually a lag in Bitcoin history between the weekly stochastic RSI reaching 100 and the accompanied price hike. Considering that, the weekly stochastic RSI is something to watch over the coming weeks. We should be alert when the indicator hits 100.

Bitcoin/U.S. Dollar stochastic RSI chart on a weekly timeframe
- Fibonacci Retracement Levels
Considering the November all-time high price and the February low price as the two extreme points of a Fibonacci sequence, Bitcoin hit the 0.382 golden ratio last week at $48,200. If it can make the 0.236 level at $42,000 as support (the exact level that the 100-day SMA is currently at), Bitcoin can climb all the way up to the other Fibo golden ratio of 0.618, which is at $56,000. $56,000 has also acted as an important weekly bull market resistance during 2021.
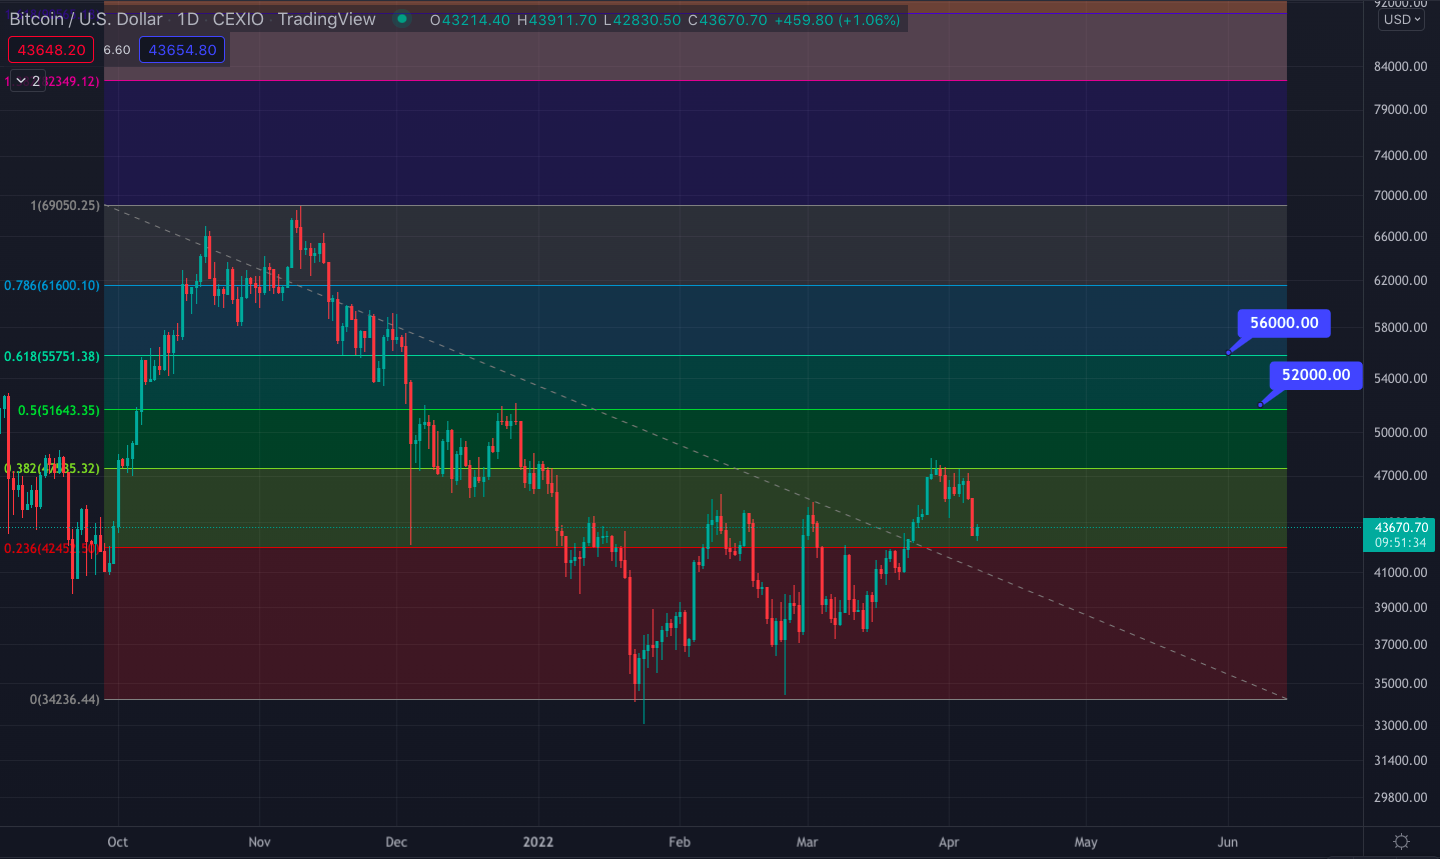
Bitcoin/U.S. Dollar Fibonacci retracements chart
- 3-Day Death Cross
Despite the positive outlook, there is still a death cross fast approaching for Bitcoin on the 3-day chart. The 3-day death cross is nothing to play with. There has been a 3-day death cross once in every four years throughout Bitcoin’s history, which was followed by a 50% crash from the bear-market demand zone (which is currently at $40,000).
The 3-day death cross forms by the crossing down of the 50 SMA by the 200 SMA. When you look at the chart below, you will see the previous death crosses along with the one approaching now (the yellow line is the 3-day 50 SMA and the red line is the 3-day 200 SMA).
Historical 3-day death crosses on the Bitcoin/U.S. Dollar chart
If Bitcoin cannot close this month above $56,000, then the death cross is predicted to happen during May, which is found by extrapolating the two moving average lines in the chart below:
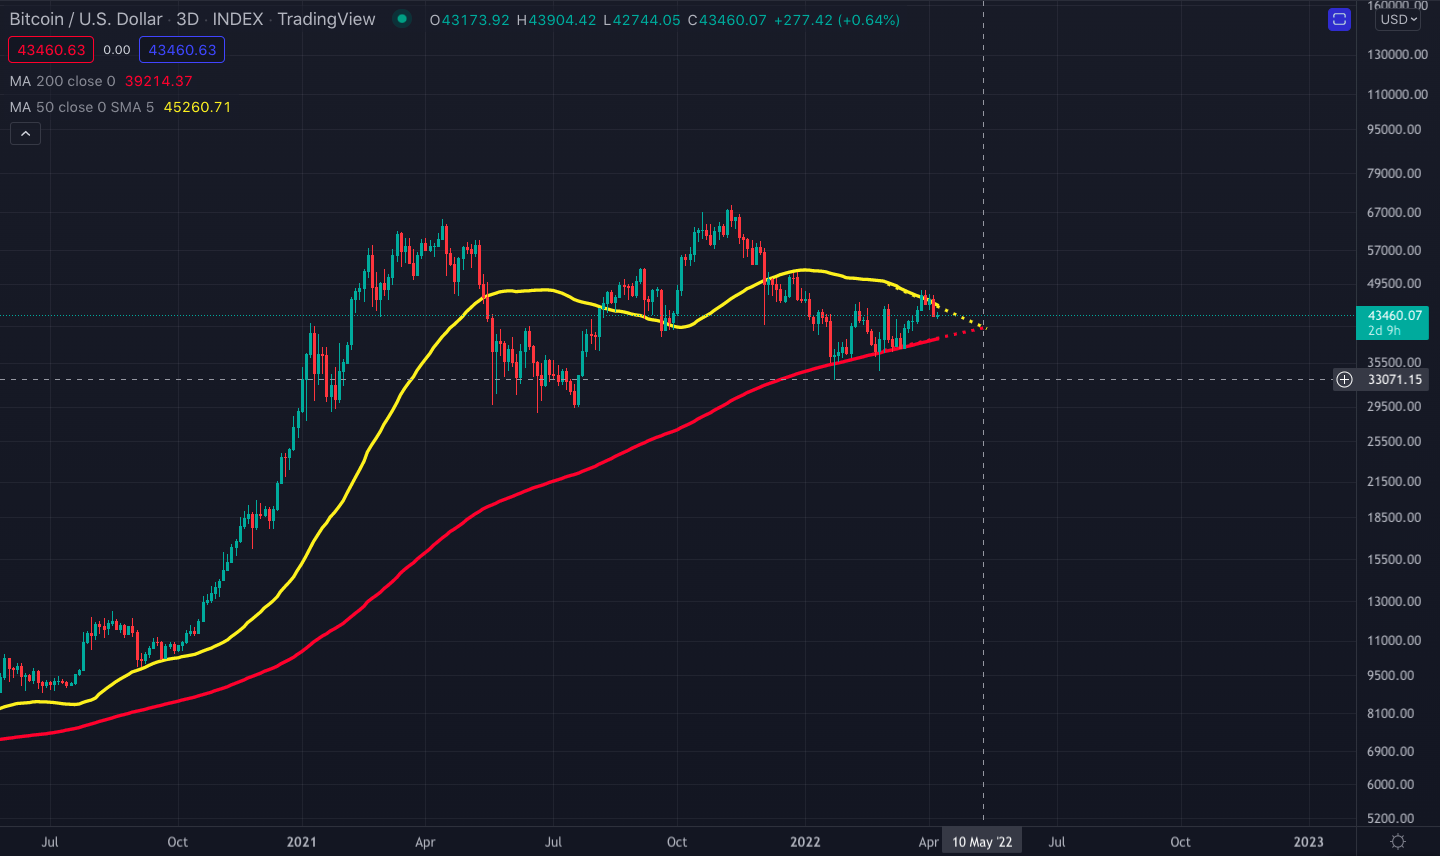
According to the moving average extrapolations in the above chart, the death cross is set to happen around May 10.
- Monthly Stochastic RSI
In the bigger picture, Bitcoin is very much out of momentum indicated by its current monthly stochastic RSI value, which is at almost zero right now. Momentum indicators in larger time frames usually take a significant amount of time to build strength as you can observe in the chart below:
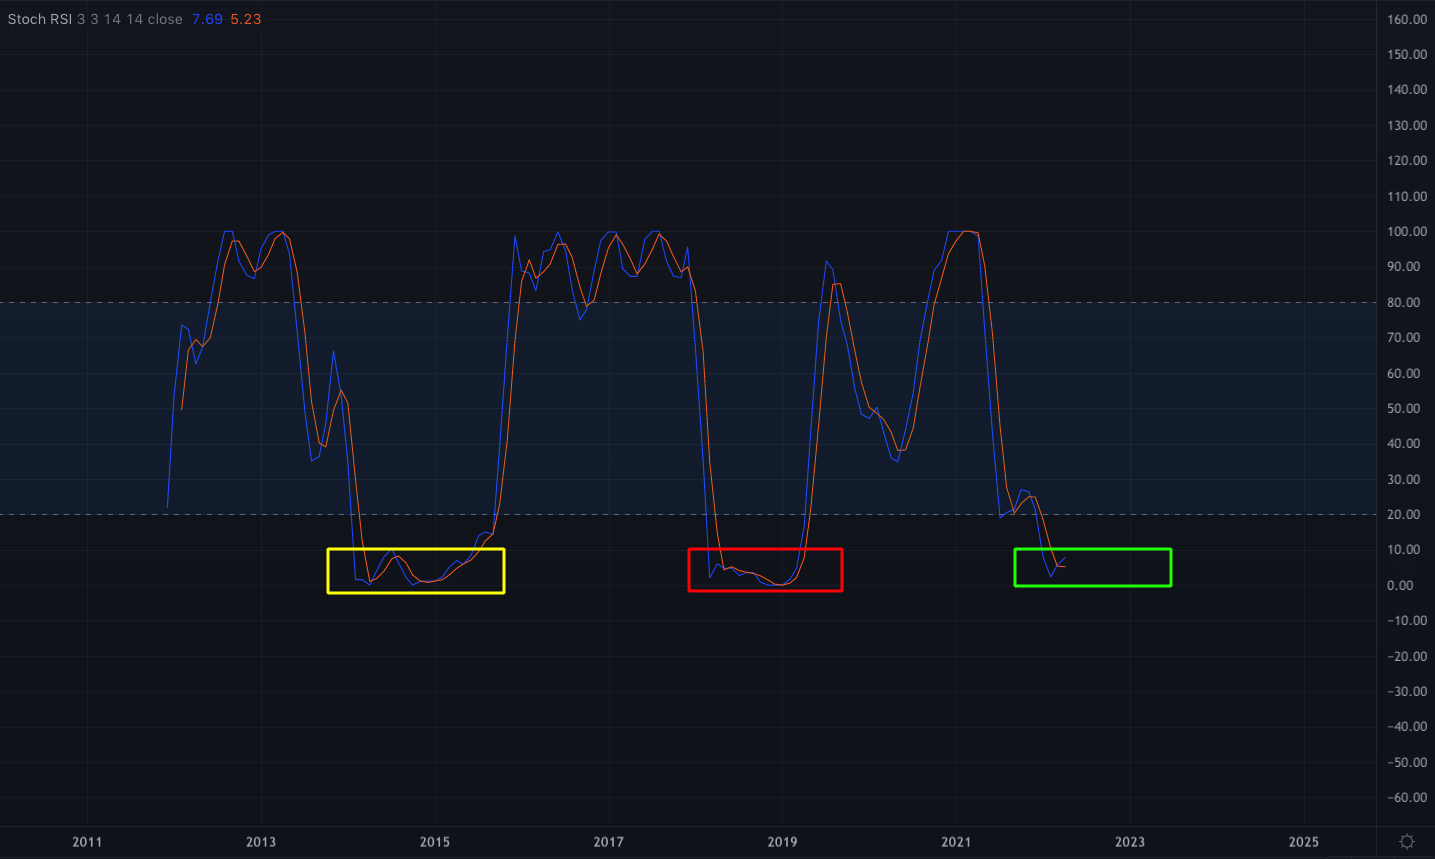
The yellow box at the bottom of the above chart is the 2014-15 bear market period, where the monthly stochastic RSI hit zero in April 2014 and it took 18 months to clear out of the resistance zone at the bottom. Likewise, Bitcoin’s monthly stochastic RSI hit zero in March 2018 (the red box) and it took 13 months for the stochastic RSI to steer clear of the bottom resistance zone.
When Bitcoin cannot build enough strength in larger time frame indicators, rallies usually get sold at major price resistance levels and Bitcoin retraces to its previous lows. This phase is usually completed by a final flush out, a capitulation event, where Bitcoin crashes by around 50% and makes the absolute cycle bottom (triggered by the 3-day death cross).
ETHEREUM ANALYSIS
Price Overview
- Last 7-day change: -1.6%
- 7-day low: $3,574.78
- 7-day high: $3,150.00
- Last 30-day change: 25.27%
- 30-day low: $2,500.00
- 30-day high: $$3,574.78
Network Overview
- ETH Burned (7-day): 36,995.05 ETH
- TX Count (7-day): 7.5 million
- TX Volume (7-day): 10.63 million ETH
- ETH Moved in/out of Smart Contracts (7-day): 306,883.65 ETH
- Net Change in Exchange Balance (7-day): -108,172 ETH
- Ethereum Technical Analysis:
Ethereum’s price action has historically been correlated to Bitcoin. Throughout the history of cryptocurrencies, Bitcoin has managed to drag Ethereum and other altcoins along with itself, either to the upside or to the downside.
The reason for this synchronized price action was that funds entering and exiting the cryptocurrency market initially flowed into Bitcoin, which then moved in and out of Ethereum and other altcoins. As a result, Bitcoin should not be on a downtrend for the Ethereum price to have an uptrend.
- 200-Day Moving Average
During downtrends and periods of uncertainty, funds sitting in cash are scared to flow into Ethereum and other altcoins in large quantities, which makes Ethereum very sensitive to the price action of Bitcoin. Currently, we are in such a stage in the cryptocurrency market. Due to this, Ethereum’s possible future price action strongly depends on that of Bitcoin.
This is proven by the fact that Ethereum similarly hit its 200-day simple moving average (SMA) resistance on April 3 (at $3,570), just a week later than Bitcoin did. This is how the cryptocurrency market usually works. Bitcoin moves first and other major coins make the same movement within a couple of days or a week later.
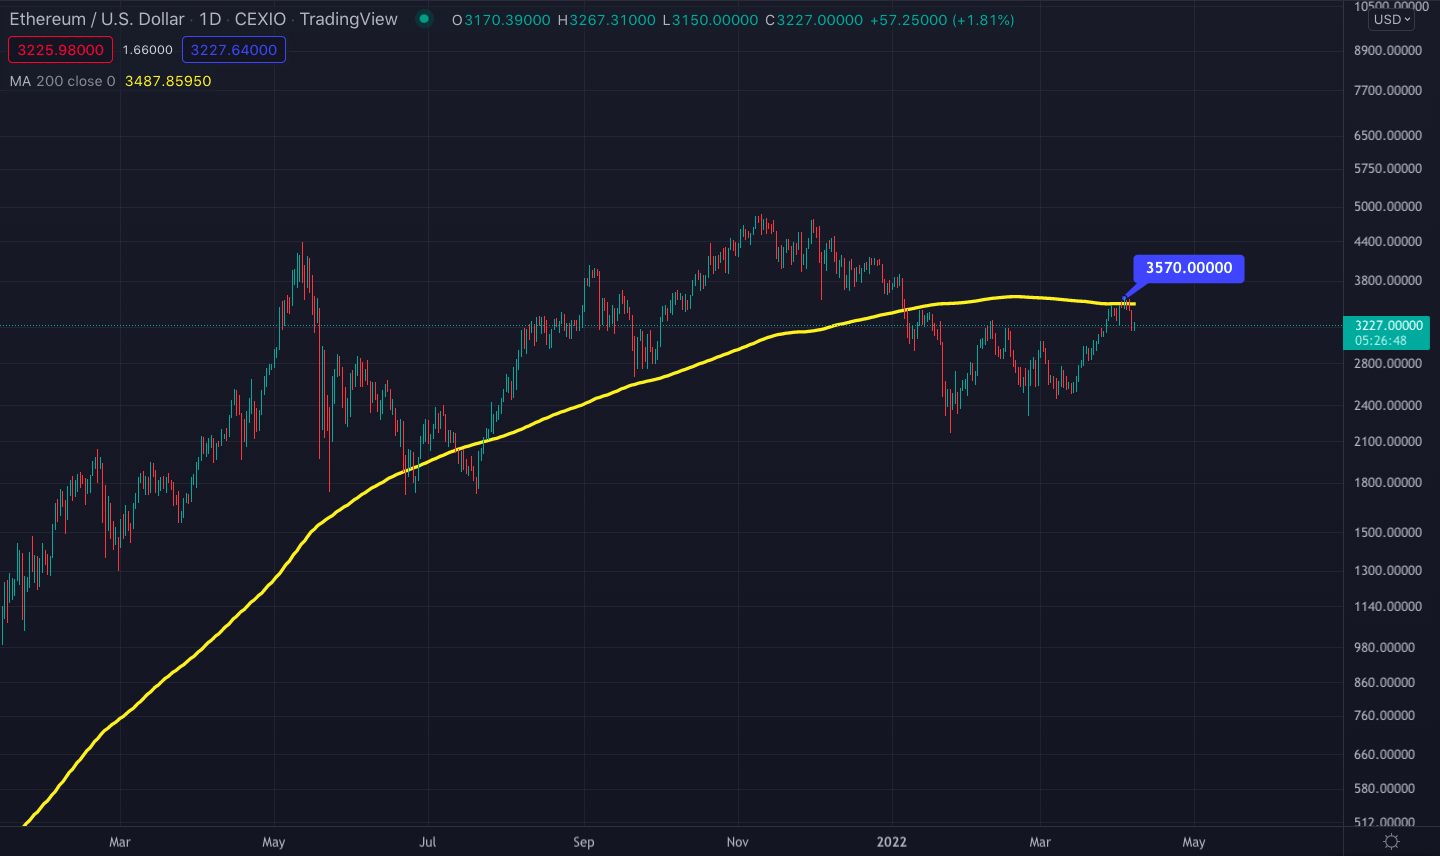
Ethereum/U.S. Dollar chart on the daily timeframe. The yellow line represents the 200-day SMA.
- Ethereum/Bitcoin Parity
To understand if it would be possible for Ethereum to relatively decouple from the price action of Bitcoin in the future, you need to look at the Ethereum/Bitcoin price chart:
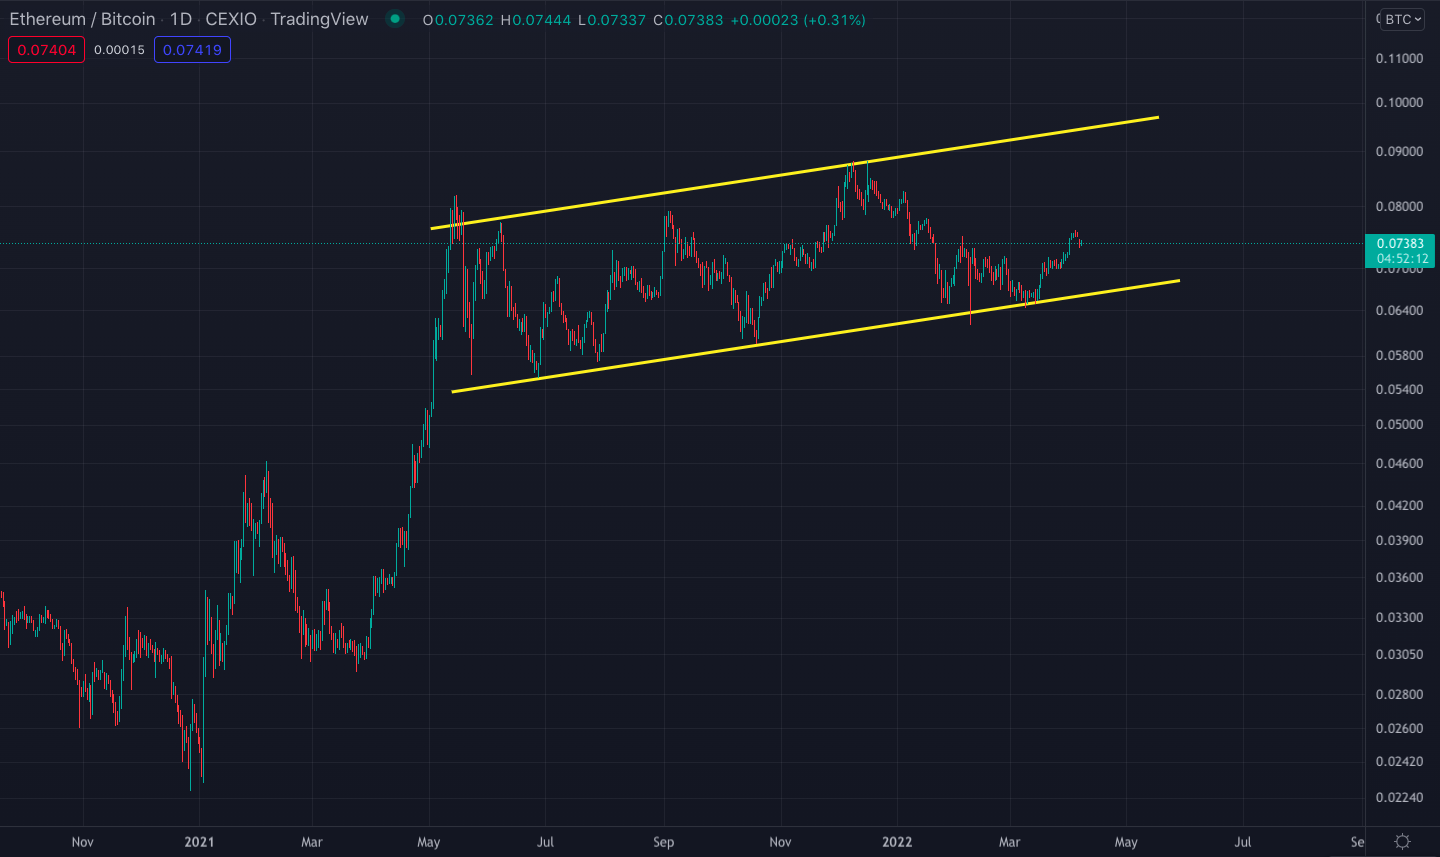
Daily Ethereum/Bitcoin price chart
The ETH/BTC parity has been moving inside a rising channel since the May 2021 market top. Although at first glance this looks like a flag structure, in a bullish flag structure, the flag should be sloping downwards, not upwards. Considering that, the current structure has a chance to eventually break downwards if cryptocurrencies enter an extended bear market.
However, considering the current positive momentum in the market, Ethereum can well move to the 0.10 resistance first, if Ethereum’s dollar price can climb above the 200-day SMA resistance. 0.10 is a historical resistance level because it constitutes the lower end of Ethereum’s all-time high price channel against Bitcoin.
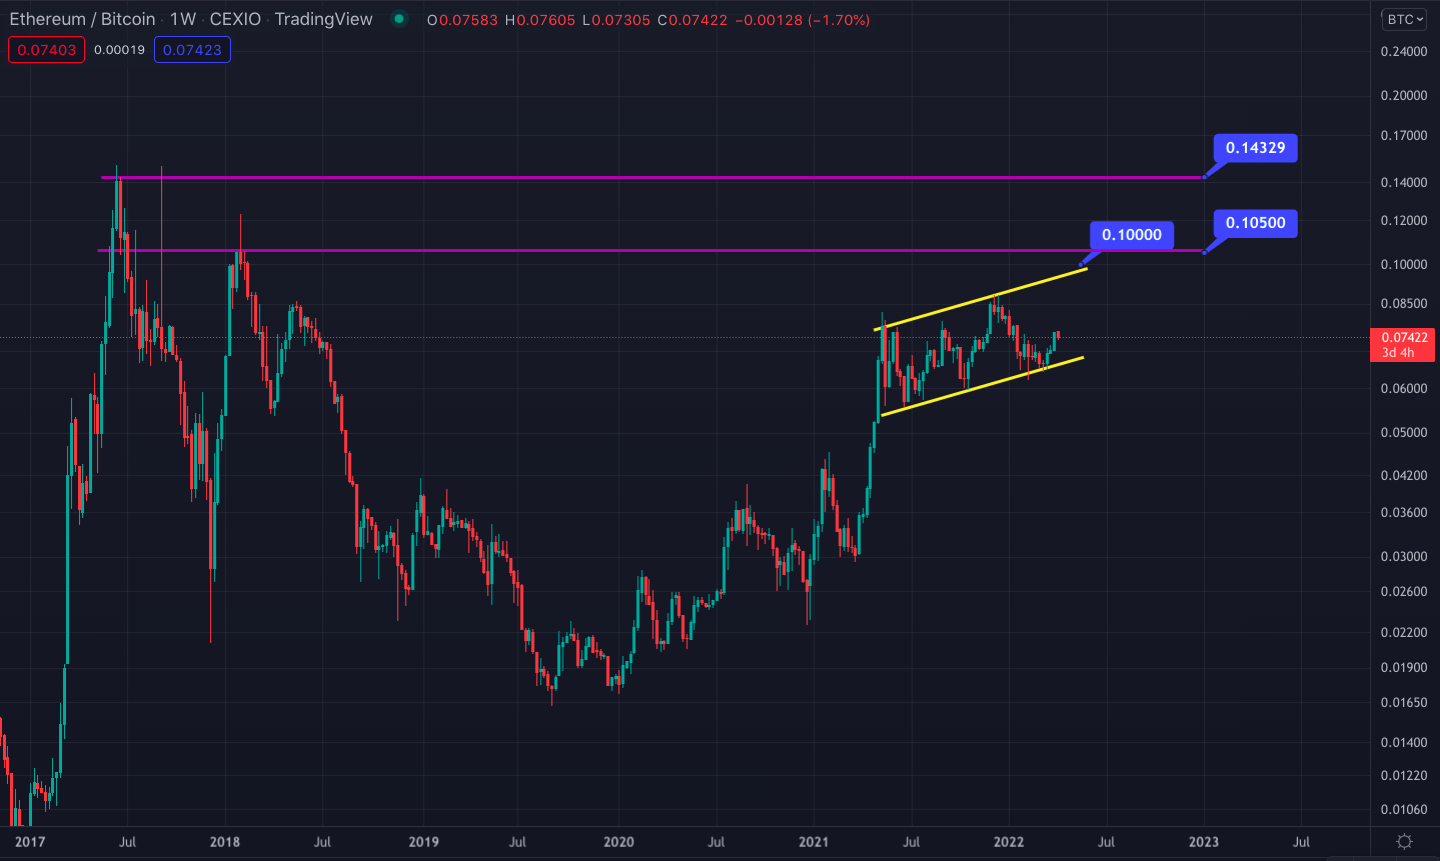
Weekly Ethereum/Bitcoin price chart
If Ethereum could break its current rising channel to the upside, it could climb as high as 0.14, which is the all-time high price in the ETH/BTC price parity.
Of course, all of this depends on the price action of Bitcoin right now. In history, Ethereum never managed to decouple from and outrun Bitcoin during a bear market. A new Ethereum all-time high price has always succeeded a new Bitcoin all-time high price (in US Dollar terms).
In that sense, it would be wise to watch the pending 3-day death cross on Bitcoin. If that cross happens, it could suggest that Ethereum will not be able to rally against Bitcoin and that the current rising channel will eventually break downwards.
CRYPTO INDUSTRY UPDATES
Luna Foundation Guard begins buying BTC
Do Kwon, the founder of the Terra blockchain, in conjunction with Luna Foundation Guard (LFG) announced a campaign to purchase a reserve of up to $10 billion in BTC. The pool of Bitcoin will contribute to the backing of UST, Terra’s native stablecoin, as a defense mechanism for the stablecoin’s peg.
UST is an algorithmic stablecoin, meaning it leverages a multi-token model to preserve its price peg. Luna plays a major role in this price stability process. 1 UST is redeemable for $1 worth of Luna at any given time. Buyers can pick up UST any time it is worth less than $1 and exchange it for $1 worth of value. Buyers earn a profit as they do this (incentive), which bolsters demand for UST and pushes its price back up to $1. This process happens rapidly, which allows UST to maintain its stable value. Bitcoin’s role in this process is to stabilize the peg as demand for UST fluctuates, by bringing an alternative support mechanism beyond the Luna exchange (redemption) procedure.
An address tied to LFG shows it has already accumulated 35,767.98073016 BTC, or ~$1.5 billion. Do Kwon noted that Terra has around $3 billion on hand to convert into BTC in the near term. The remaining capital will come from the seigniorage of UST production. **Add color on the relative size of their BTC pile once its known**
Microstrategy adds to its BTC Treasury
Microstrategy, with Michael Saylor at its helm, has been a massive buyer of bitcoin since August 2020. The company announced the purchase of an additional 4,167 BTC on April 5, pushing its treasury holdings to ~129,218 BTC. In the past, Microstrategy has issued debt, raised capital through stock offerings, and used free cash to fund its bitcoin expenditures. This most recent purchase was different in that the company used $820 million of its BTC as collateral to take out a $205 million loan. The loan was issued by a unit of Silvergate Bank, which has been a proponent of bringing banking solutions to the cryptocurrency and fintech spheres.
After this purchase, Microstrategy has converted approximately $4 billion into BTC at an average price of $30,700. At the time of writing the company’s holdings are valued at ~$5.8 billion, equating to a $1.8 billion-plus gain. Michael Saylor has made it clear that his strategy is to continue buying bitcoin. He holds the largest corporate BTC treasury, ahead of Tesla and Marathon Digital, by more than 86,000 BTC.

You can get bonuses upto $100 FREE BONUS when you:
💰 Install these recommended apps:
💲 SocialGood - 100% Crypto Back on Everyday Shopping
💲 xPortal - The DeFi For The Next Billion
💲 CryptoTab Browser - Lightweight, fast, and ready to mine!
💰 Register on these recommended exchanges:
🟡 Binance🟡 Bitfinex🟡 Bitmart🟡 Bittrex🟡 Bitget
🟡 CoinEx🟡 Crypto.com🟡 Gate.io🟡 Huobi🟡 Kucoin.


Comments