This weekly piece of cryptocurrency price analysis and thought leadership is brought to you by the expert team at CEX.IO, your crypto guide since 2013. At CEX.IO, we’re committed to providing our users with the latest price updates and the scenarios that could subsequently unfold.&
In this week’s update, we discuss whether Bitcoin’s latest rally from $19,200 to $21,000 could finally be the move that marks the start of a new bull run.
If Bitcoin could close a day above $21,900, the likelihood of an uptrend could significantly increase, which in turn may signal& bull runs across the board for other cryptocurrencies. With that in mind,, the 36th edition of our Crypto Ecosystem Update also explores& the next potential moves of Ethereum, Cardano, Dogecoin, and Elrond.&
Read along for in-depth breakdowns and enjoy reviews of correlated markets to help you make the most informed decisions along your crypto journey.
Is it this time for Bitcoin?
Bitcoin’s volatility has dropped to historically low levels with daily price fluctuations dropping to as low as 1.5%. Due to this, the sudden move on Tuesday, October 25 from $19,200 to $21,000 caused excitement in the market.&
Since early September, Bitcoin’s every attempt to break out was met with rejection. As a result, each time the alpha cryptocurrency lifts its head, the market naturally gets excited considering the sheer number of people who experienced a loss since 2021.&
All this seems to beg the questions: could this be the moment the markets have been craving?
Lower trading volume
A point of concern regarding this week’s breakout attempt is that so far it’s come with a lower buying volume compared to previous attempts (see the chart below).&

Bitcoin/U.S. dollar price chart with the daily volume bars. Source: Tradingview.
Unless a significantly higher daily volume joins the scene soon, this last attempt could act as another and potentially final failed rally before sailing to new lows below $18,000.&
S&P 500 at major resistance
Another point of concern is that the S&P 500 stock index, the asset class to which Bitcoin has been most closely correlated, hit a major resistance on the same day as Bitcoin’s rally (see the chart below).&
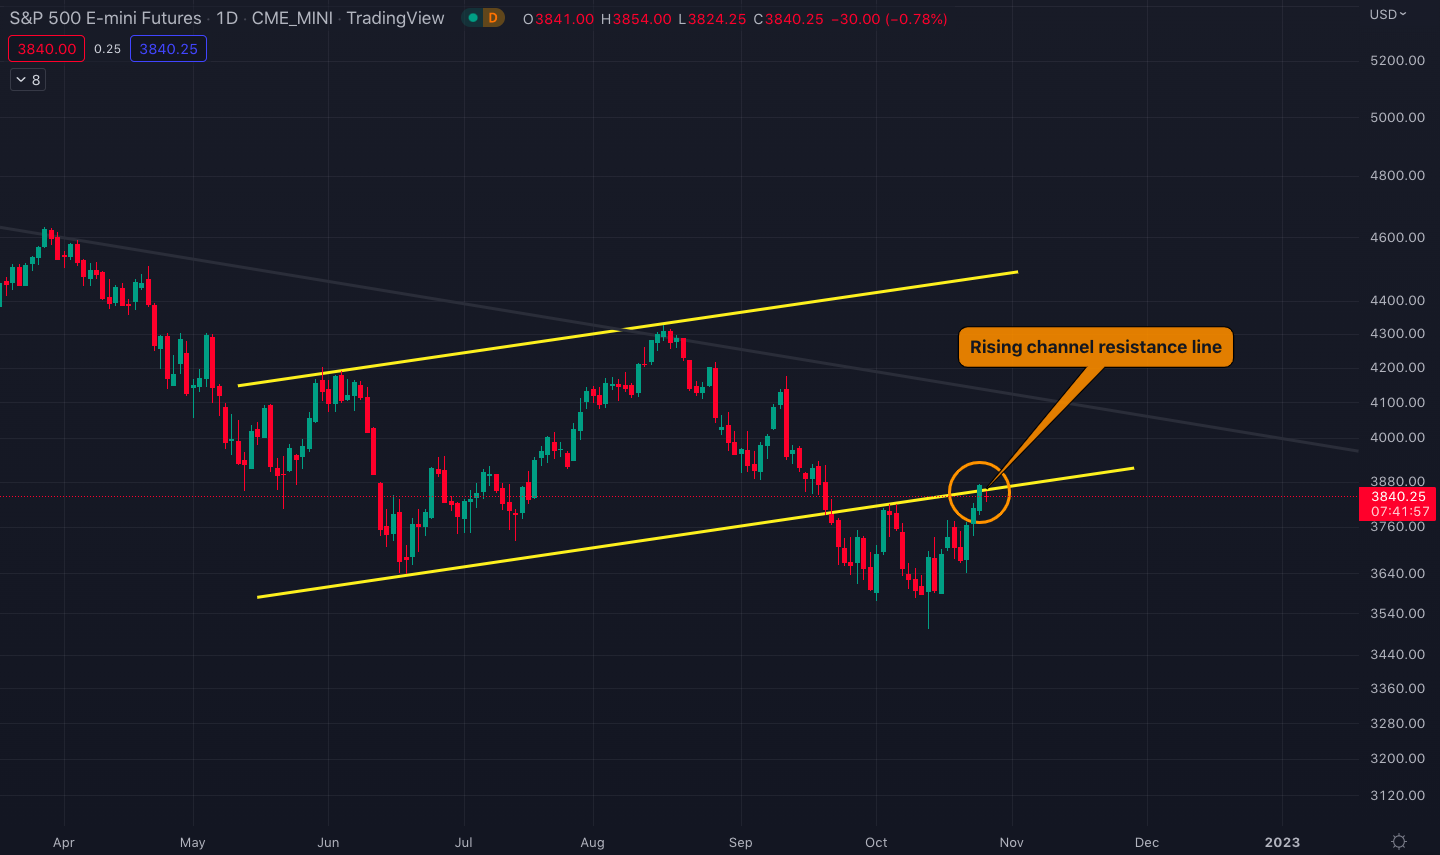
S&P 500 price chart with the rising channel resistance line.&
If the S&P 500 index fails to close this week above the former rising channel’s resistance line, it could be possible for Bitcoin’s current breakout attempt to end up as another failed rally.&
Daily RSI breaking above a key resistance&
On the flip side of the picture, Bitcoin’s daily relative strength index (RSI) is now breaking above the 62 level, which has continuously acted as resistance and marked the top of the failed rallies in 2022 (see the chart below).&
RSI measures the speed and magnitude of an asset’s recent price changes, and often acts as a precursor for future price action. Considering this, an explosive price movement could be around the corner for Bitcoin if its daily RSI throws a new leg to the upside above 62.&
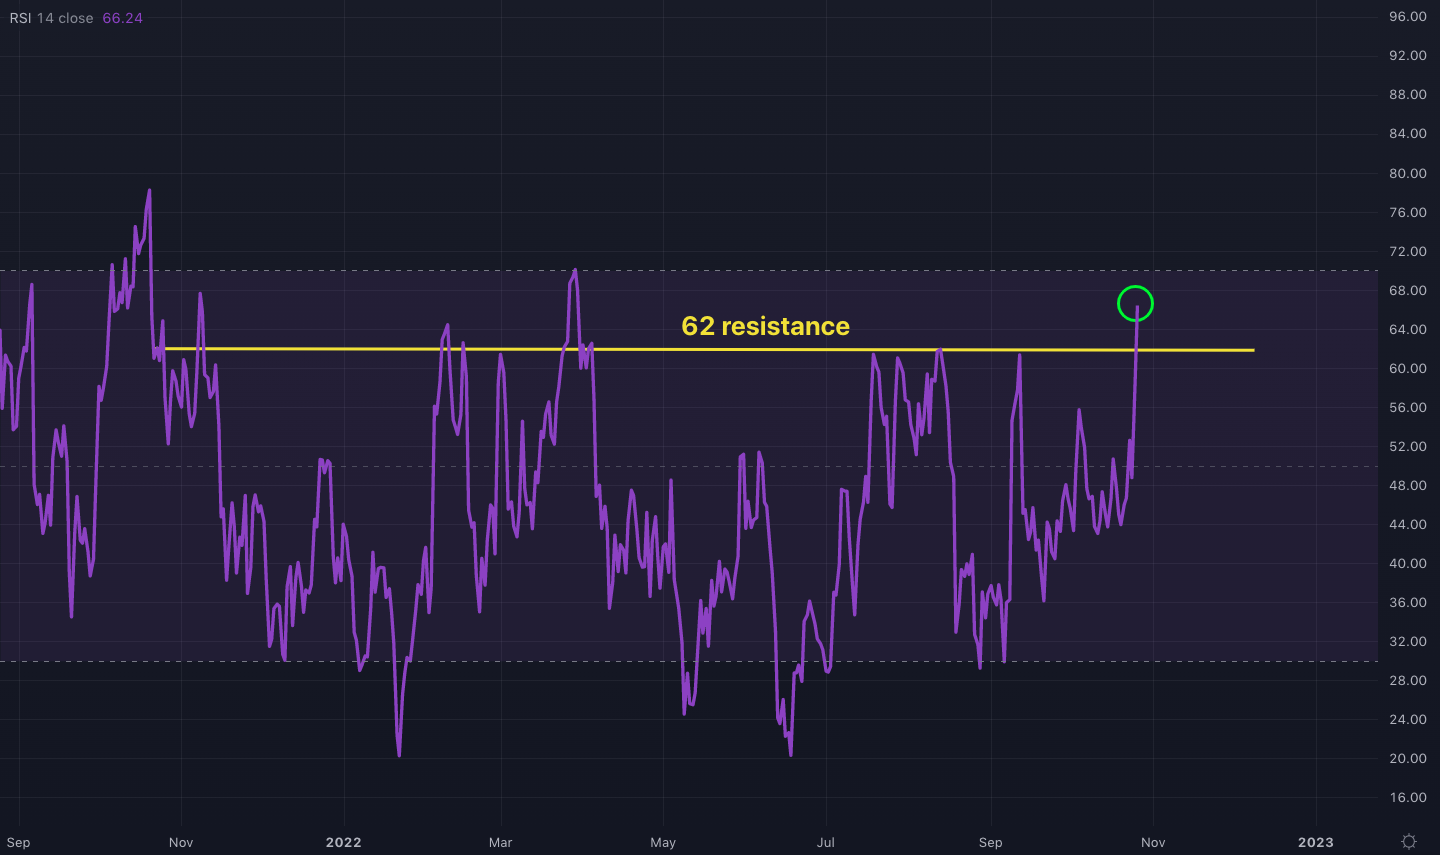
Bitcoin’s daily RSI breaking above the 62 resistance.&
Ethereum gave the signal for Bitcoin
Ethereum has been in a downtrend since the Merge event, in a typical “buy the rumor, sell the news” fashion. Following the summer’s rally that peaked at $2,000, the second-largest cryptocurrency dropped to a low of $1,200 on September 21.
However, the price has been glued to the $1,200-$1,300 level since then and formed a strong base there. This support level previously acted as resistance during June and July’s bottoming phase (see the chart below).&
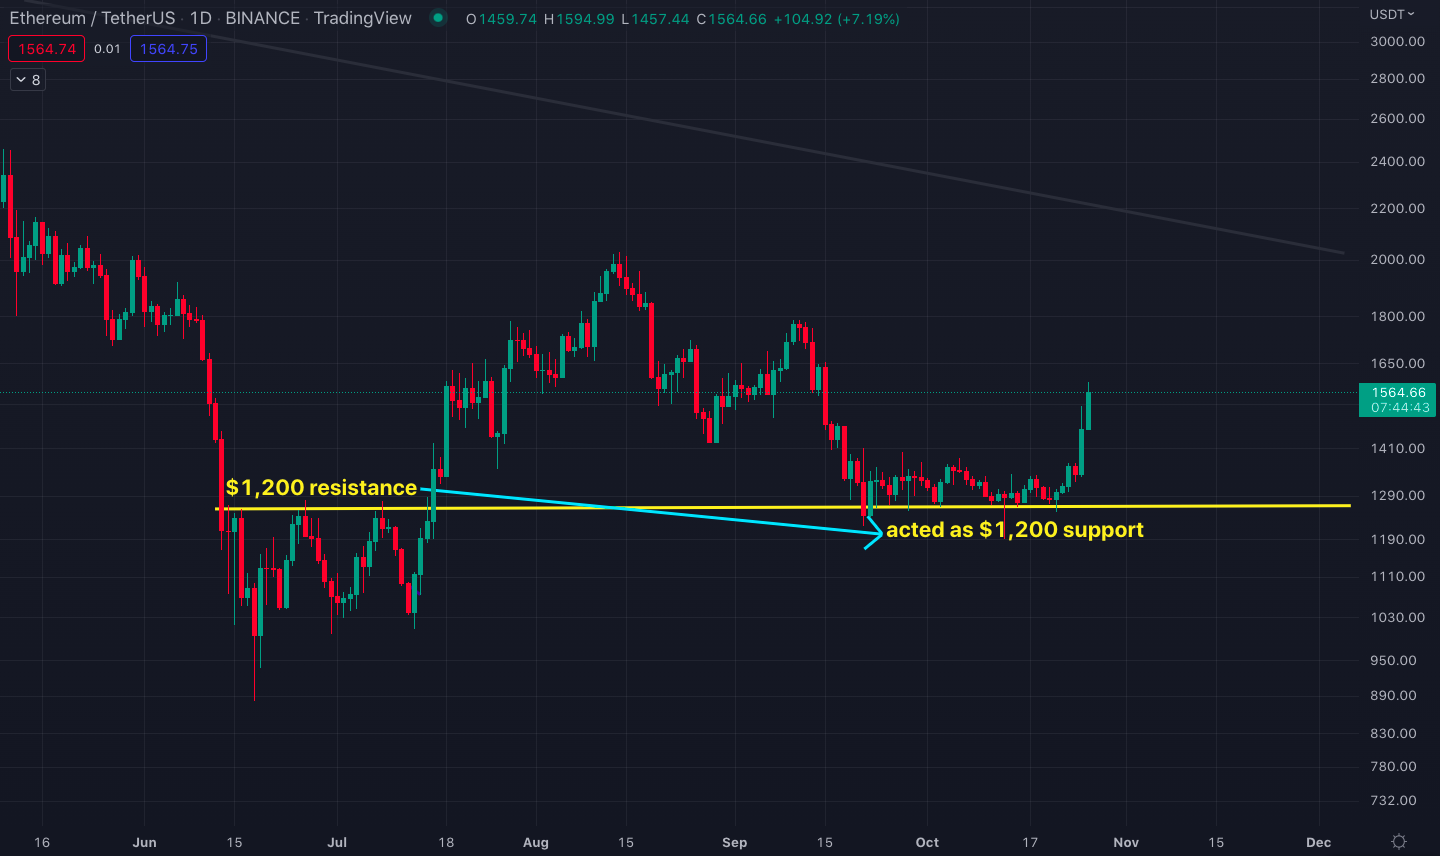
Ethereum/U.S. dollar chart with the former $1,200 resistance flipping to support.
While testing a support level multiple times can potentially weaken it since each movement reduces the number of outstanding orders and thus market liquidity, it could also prove the opposite when that support is a former resistance. This has been the case with Ethereum’s recent price action, which could have been a clue for understanding Bitcoin’s next direction.&
Historically speaking, Bitcoin and Ethereum have usually moved together, albeit in differing magnitudes. Bitcoin has retraced all the way to its June bottom ($18,000) this month while Ethereum formed a higher-low base compared to its June low ($900).&
During correction periods, double bottom patterns are more uncertain in determining the direction of an asset’s next move, compared to higher-low bases. Since Bitcoin and Ethereum tend to trend together, Ethereum’s cruising on the $1,200-$1,300 support for over a month could indicate that Bitcoin had the potential to break to the upside – something that many traders may have missed.&
And when Bitcoin finally broke to the upside on October 25, instead of the downside, the price of Ethereum followed suit with an explosive move to $1,600.&
In terms of the ETH/BTC trading pair, the parity also surged during the last three days.&
Following the Merge, the parity corrected from 0.085 to a low of 0.066. It has kept that level as consistent support since then, just like the $1,200 floor in the USD parity. In addition, the price has continuously sat on the descending resistance line that was in effect from November 2021’s all-time high, which evolved into strong support to add further confluence into the picture (see the chart below).&
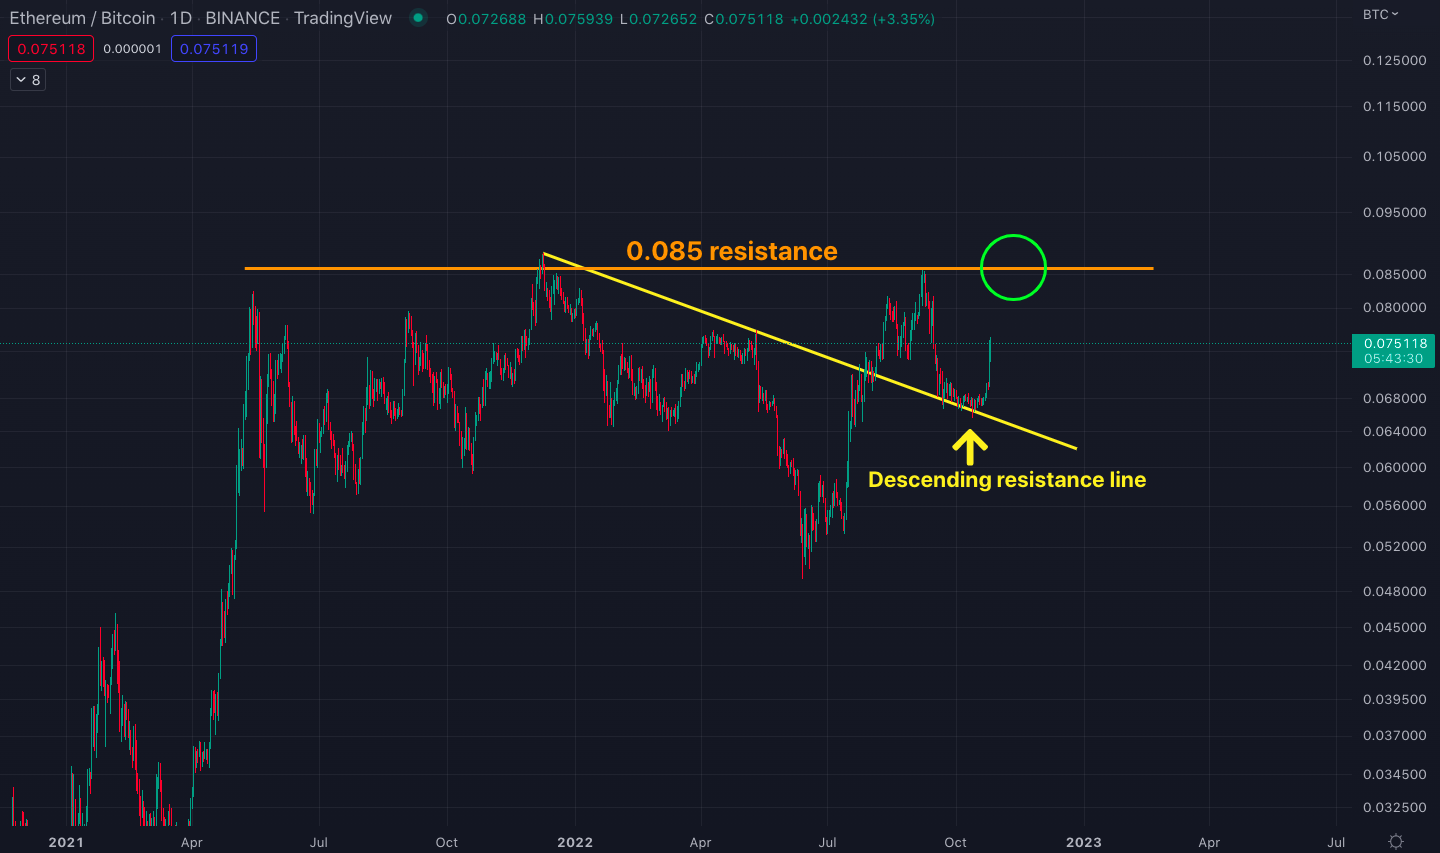
Ethereum/Bitcoin chart with the 0.066 support and the 0.085 resistance.&
In response to Bitcoin’s pump from $19,200 to $21,000, the parity surged to 0.075 on October 26. If ETH/BTC can flip the 0.085 historical resistance into support upon a weekly or monthly close, it could be off to the races to a possible new all-time high parity price.&
With all that said, if Bitcoin starts a proper uptrend with Ethereum following in its footsteps, then Ethereum could be on a run to the descending resistance line in its USD trading pair, which corresponds to $2,200.
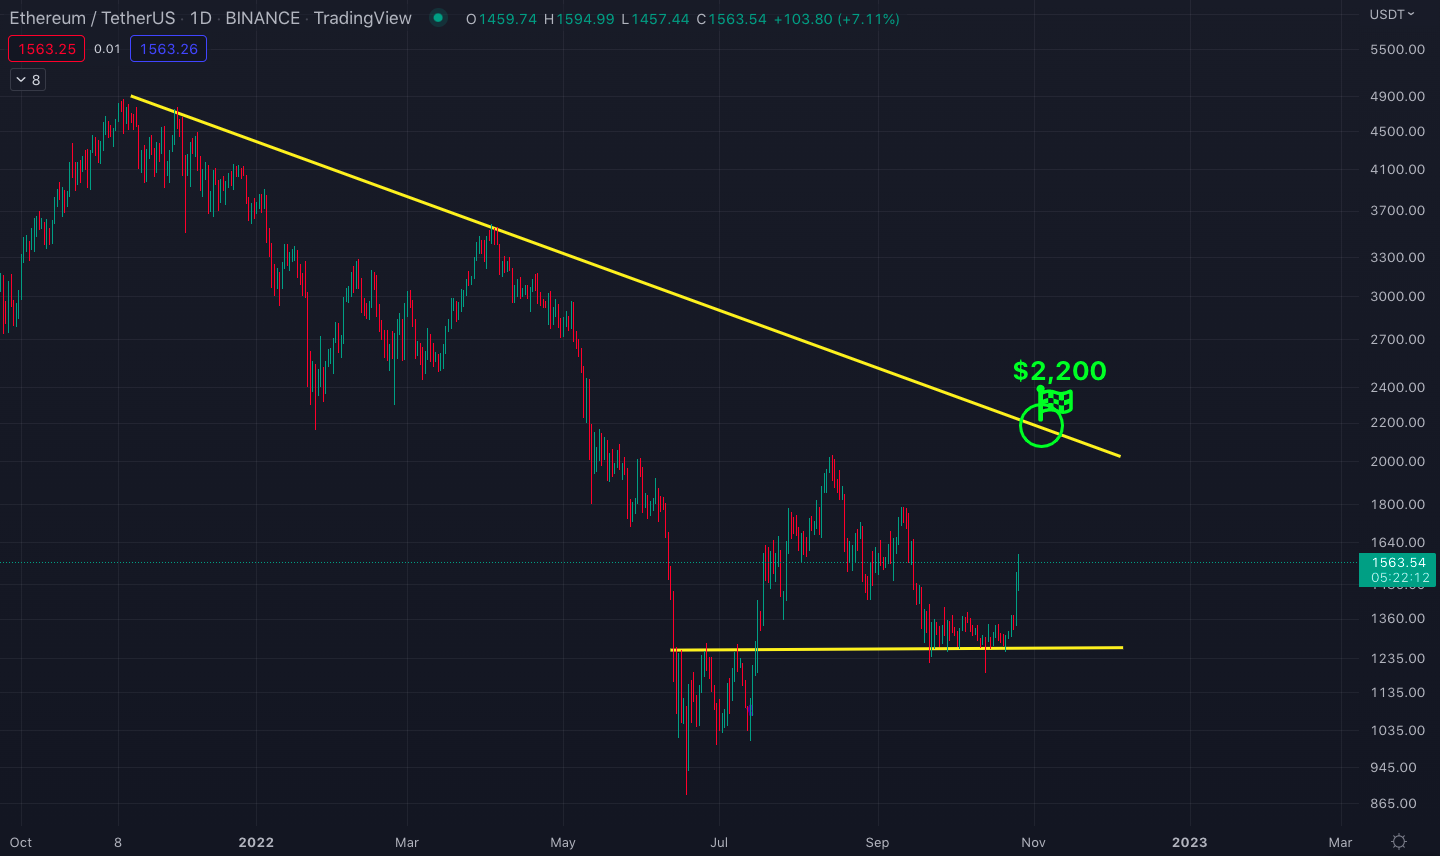
Ethereum/U.S. dollar price chart with the $2,200 descending resistance target.
Cardano’s violent comeback
Cardano’s hard fork in late September failed to generate the hype that its enthusiasts were expecting with a big rally like the one Ethereum experienced with its Merge remaining largely absent.&
$ADA, the platform’s native token, had been moving inside a descending triangle until the hard fork. The lack of new expectations thereafter subsequently caused the triangle to break down (see the chart below).&
Since the breakdown from the descending triangle, the price of ADA continued to fall from the triangle’s base at $0.40 to a low of $0.33 on October 21.&
Although the price target from the breakdown would normally be at around $0.24, ADA came back with a vengeance from $0.33 in conjunction with this week’s Bitcoin pump. In contrast to other major cryptocurrencies, Cardano’s move has been more abrupt which caused the price to quickly climb back to the triangle.&
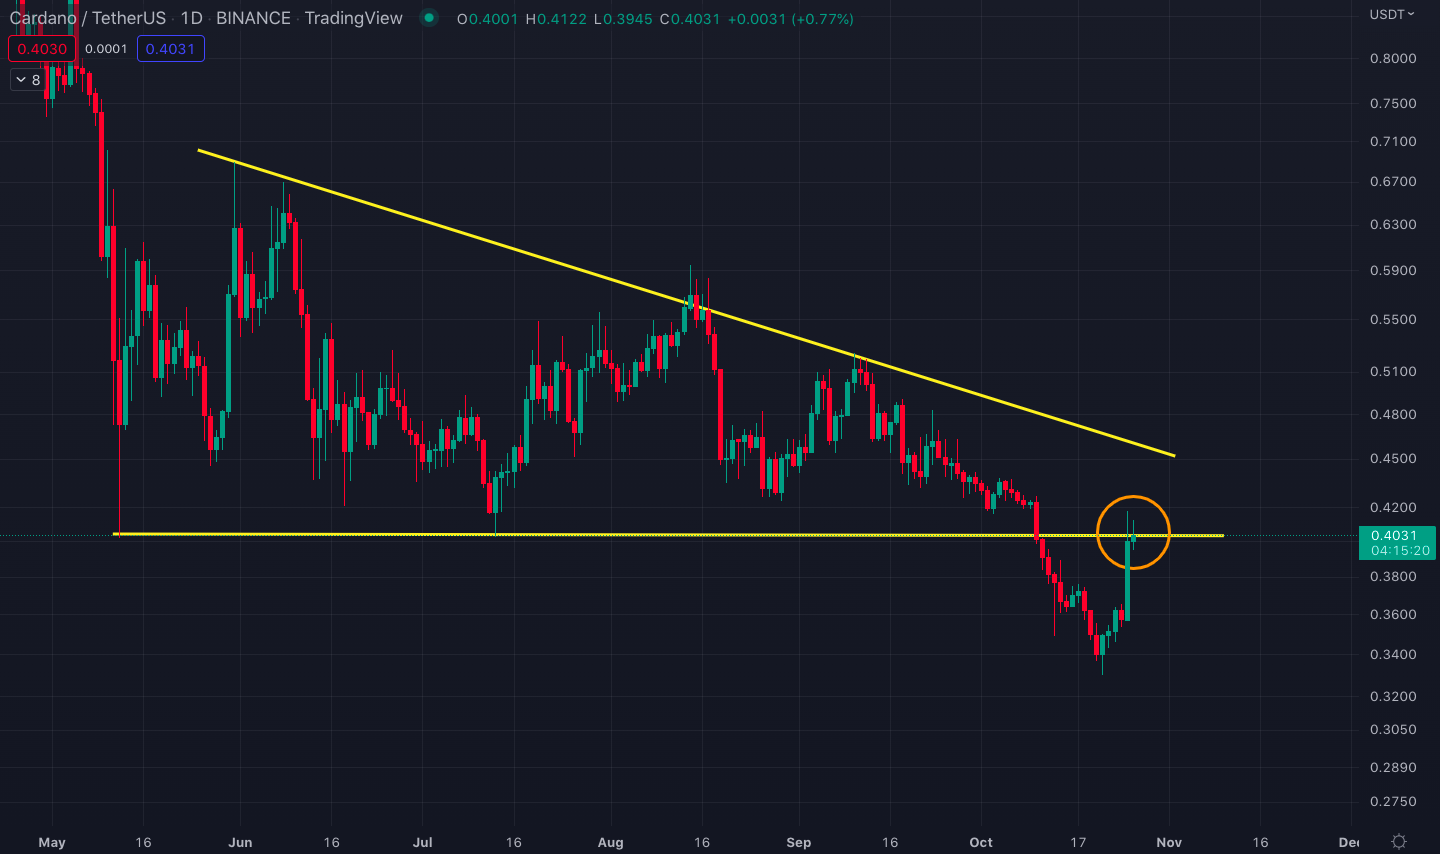
Cardano/U.S. dollar chart with the descending triangle and the $0.4050 resistance.
The base of the descending triangle is now acting as resistance at $0.4050. So far, Cardano has failed to break and close above this resistance. In addition, continuous wicks to the upside in lower time frames appear to hint at rejection.&
In that light, the base of the triangle at $0.4050 is the critical level to watch for Cardano. ADA needs to close at least a few days above this level and inside the triangle to start a sustainable uptrend.&
Otherwise, a decisive rejection at the triangle could trigger a much larger selloff which could this time end at the previous $0.24 target price.&
Another possibility is ADA ripping through the $0.4050 resistance and getting heavily rejected at the triangle’s descending resistance, which currently corresponds to $0.46.&
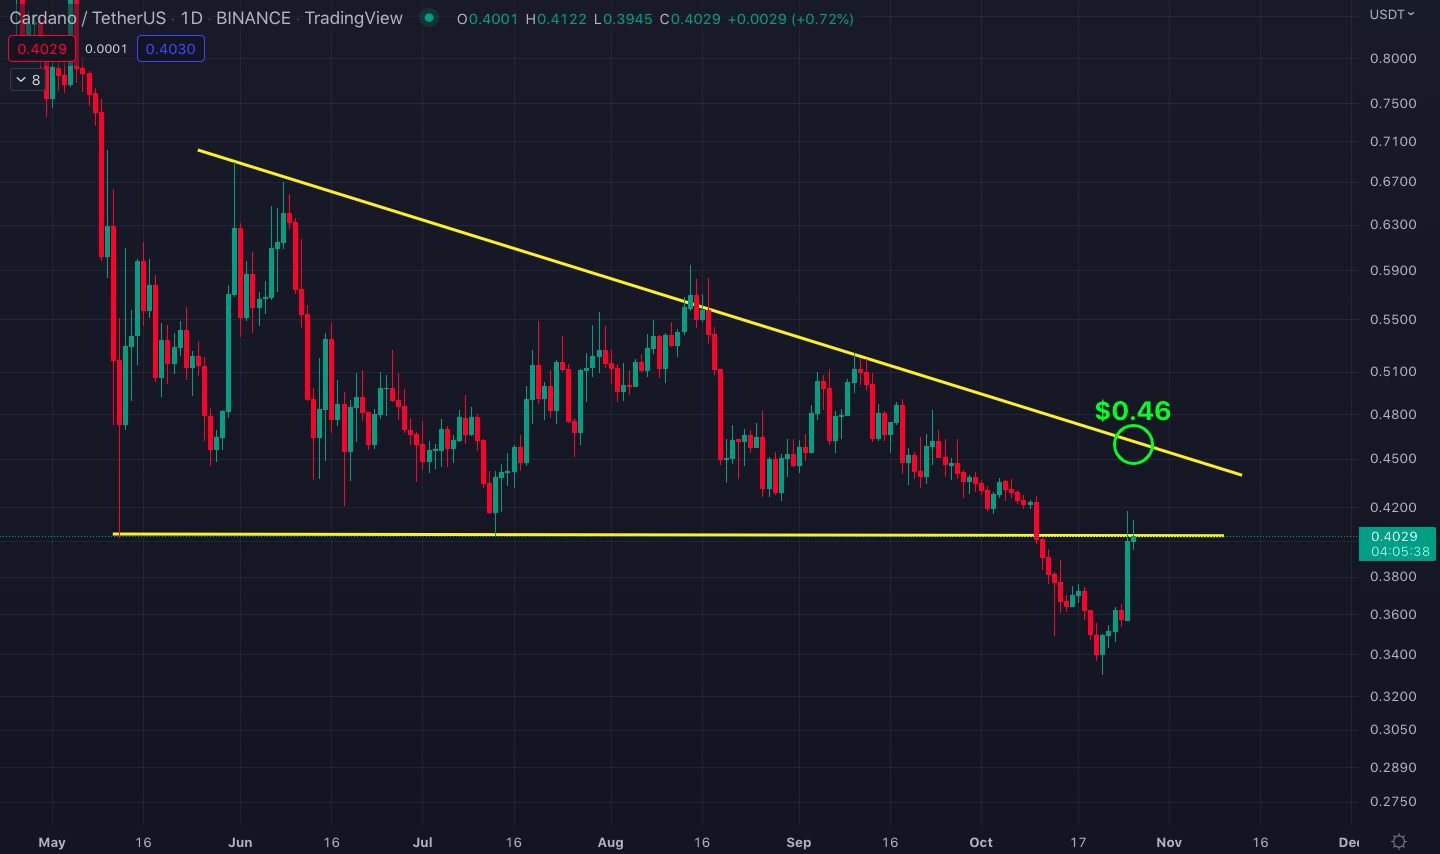
Cardano/U.S. Dollar chart with the $0.46 target at the descending resistance line.
Will the Twitter deal blast off Dogecoin?
Following Elon Musk’s announcement about the verdict of his Twitter deal, Dogecoin has surged by 40%. Musk’s favorite meme coin started moving on October 26, in tandem with Bitcoin, but it blasted off the next day with a 30% price gain.
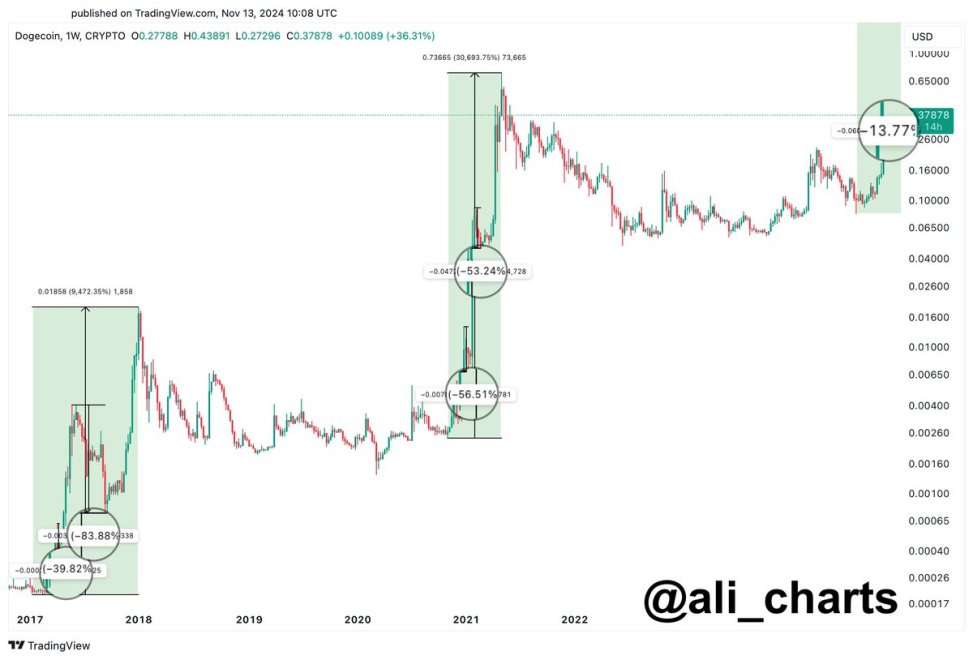
If Bitcoin doesn’t spoil the party and no last-minute surprises come from the Twitter side, $0.09 looks like a very natural target for Dogecoin this week, which would form a potential Adam and Eve reversal pattern (see the chart below).&
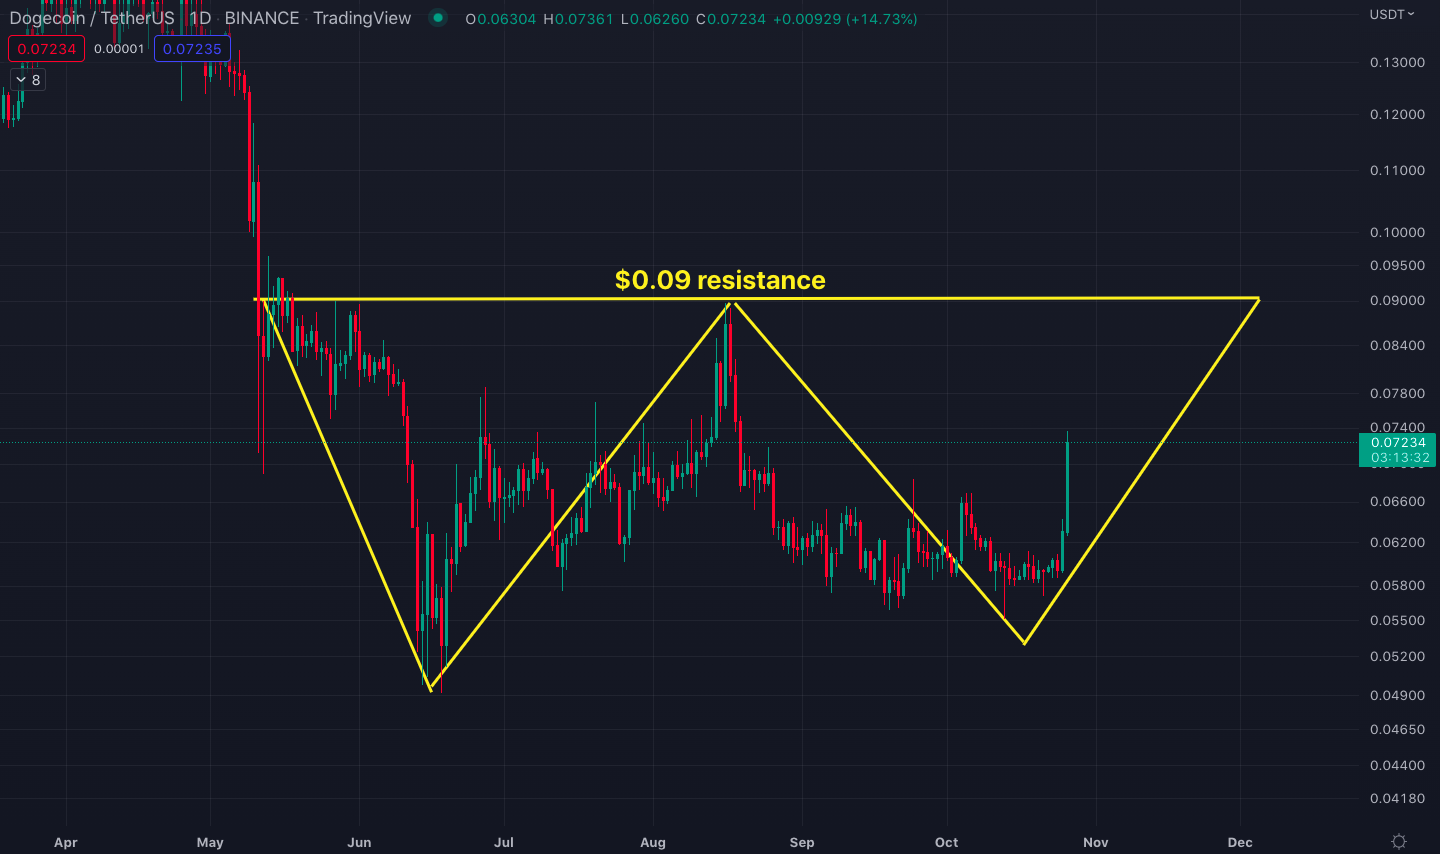
Dogecoin/U.S. dollar chart with the $0.09 target and the potential Adam and Eve formation.&
If Bitcoin starts a decisive uptrend and rallies to the 2021 bull market resistance at $29,000, DOGE could flip the $0.09 resistance to support and make an additional leg up from there. In that case, the price target could reach as high as $0.15, which is estimated by taking the height of the ongoing W formation and extrapolating that height above the $0.09 resistance (see the chart below).
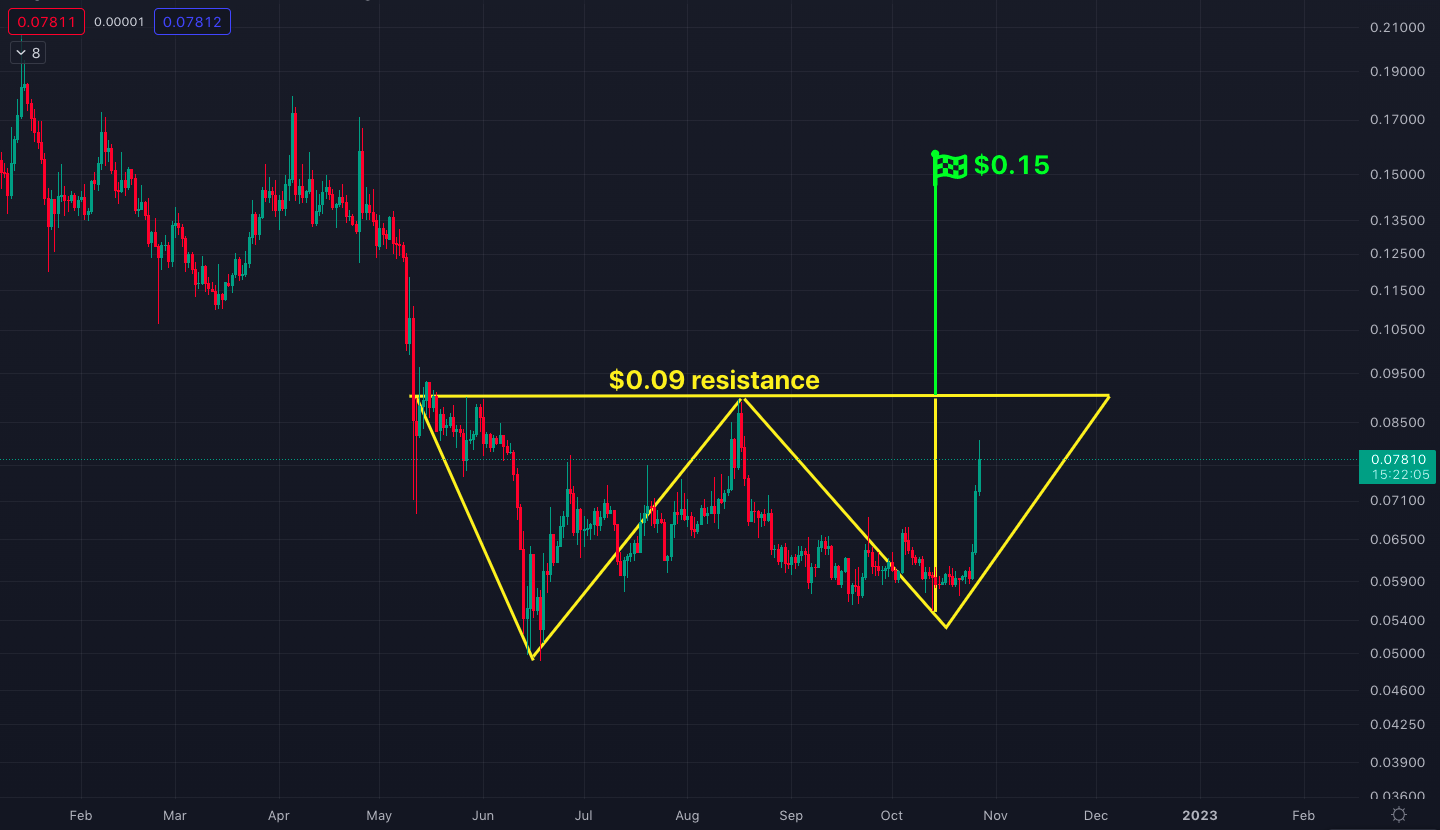
DOGE/USD price chart with the potential $0.15 price target.
Elrond could be the party’s late arriver
Elrond, the latest addition to the CEX.IO ecosystem, shocked the entire crypto world with its jaw-dropping 1,000x run during the 2020/21 bull run. The layer 1 (L1) blockchain was at the center of the attention thanks to its sharding technology that offered extremely fast transaction speeds.&
The hype around Elrond has died since last year and we have not been hearing much about this former blockbuster cryptocurrency. Even since the June market bottom, the price of $EGLD, Elrond’s native currency, did little to stand out from its competitors.&
However, this silence may soon come to an end if EGLD can break out from its current consolidation that is sitting at the top of a flag pole (see the chart below).
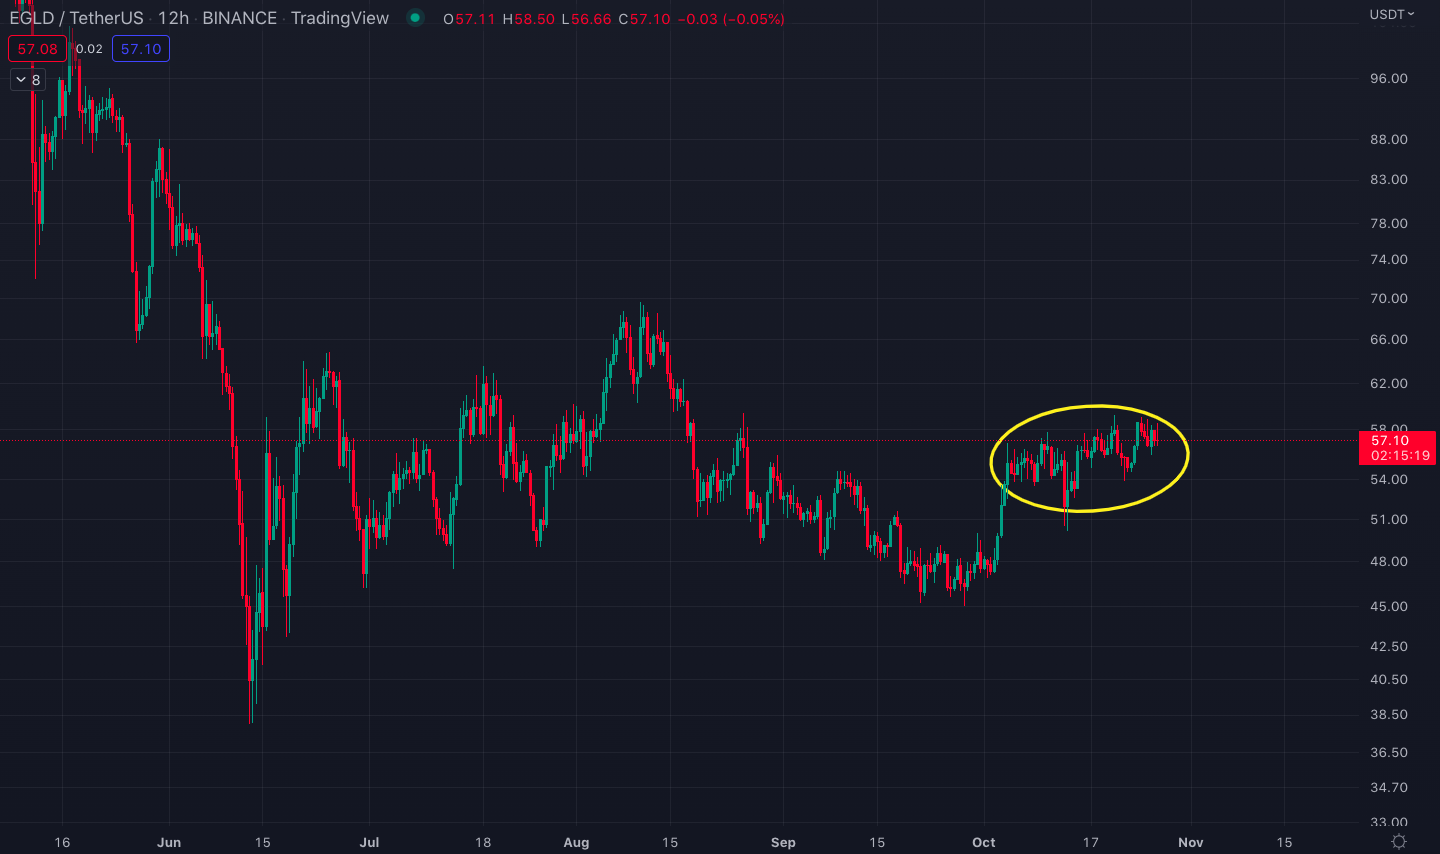
Elrond/U.S. dollar chart with the current consolidation area circled in yellow.
Although rising consolidations at the tip of flag poles (yellow-circled area in the chart above) often break down during bear markets, it could also behave exactly the opposite if Bitcoin continues its recent rally. If that happens, the price movement could be quite ferocious as EGLD has been a laggard throughout the year, possibly caused by lack of faith in the project.&
Tune in next week, and every week, for the latest CEX.IO crypto ecosystem update. For more information, head over to the Exchange to check current prices, or stop by CEX.IO University to continue expanding your crypto knowledge.
Disclaimer: Information provided by CEX.IO is not intended to be, nor should it be construed as financial, tax or legal advice. The risk of loss in trading or holding digital assets can be substantial. You should carefully consider whether interacting with, holding, or trading digital assets is suitable for you in light of the risk involved and your financial condition. You should take into consideration your level of experience and seek independent advice if necessary regarding your specific circumstances. CEX.IO is not engaged in the offer, sale, or trading of securities. Please refer to the Terms of Use for more details.

You can get bonuses upto $100 FREE BONUS when you:
💰 Install these recommended apps:
💲 SocialGood - 100% Crypto Back on Everyday Shopping
💲 xPortal - The DeFi For The Next Billion
💲 CryptoTab Browser - Lightweight, fast, and ready to mine!
💰 Register on these recommended exchanges:
🟡 Binance🟡 Bitfinex🟡 Bitmart🟡 Bittrex🟡 Bitget
🟡 CoinEx🟡 Crypto.com🟡 Gate.io🟡 Huobi🟡 Kucoin.


Comments