This weekly piece of cryptocurrency price analysis and thought leadership is brought to you by the expert team at CEX.IO, your crypto guide since 2013. At CEX.IO, we’re committed to providing the latest price updates and industry developments to help our users make the most informed decisions along their crypto journeys.&
In this week’s update, we discuss the reasons behind FTX’s demise as well as where the crypto market could be headed next in its aftermath.&
In the 39th edition of the Crypto Ecosystem Update, we also provide a review of the cryptocurrency products that have benefited from FTX’s collapse.
Read along for in-depth breakdowns and enjoy reviews of correlated markets as we try to weather this storm together.
Why did FTX collapse?
According to the insights that have been surfacing, there are three major developments that facilitated FTX’s collapse:
- Margin trading with user funds: FTX was predominantly a margin trading exchange, which allowed its users to borrow digital assets and increase the leverage in their trades. However, the exchange utilized user funds excessively and without consent when lending out to margin traders.
When panic struck the crypto community last week following FTX’s insolvency, a bank run ensued where users rushed to withdraw their funds from the exchange. However, due to excessive margin lending, requested user funds were not available as they were being used by margin traders. This exponentially exacerbated FTX’s liquidity shortage, which is reported to be around $8 billion. - Exposure to the FTT token: FTX had used its exchange token, FTT as collateral when taking out loans. To keep the token’s value afloat, the exchange was using its profits to buy back and burn FTT tokens. Triggered by Changpeng Zhao’s tweet last week about liquidating Binance’s entire FTT holdings (worth hundreds of millions of dollars), the snowball effect that followed caused the value of FTT to collapse from $25 to a low of $1.07.
Subsequently, the collapse of the FTT token caused FTX to default on its loans. - Alameda bailout: According to Coinmetrics, FTX might have provided a massive bailout earlier for Alameda Research, its sister trading firm, by injecting 173 million FTT tokens (the equivalent of $4 billion) into the company. Following the capital injection, Alameda reportedly owed FTX $10 billion after taking loans funded by deposits from FTX customers.
Is the bottom in for Bitcoin?
The price of Bitcoin dropped to a low of $15,500 last week when the tensions and fears surrounding cryptocurrency exchanges spiked through the roof.&
It has been a choppy ride since then with Bitcoin trying to float above $16,000.&
With the U.S. dollar index (DXY) and the U.S. bond yields (US02Y and US10Y) plummeting from their October highs, the scene could be more promising now for risk-on assets if no other black swan events join the scene.& & & &
We cannot predict whether the recent liquidity crises and bankruptcies in the crypto ecosystem will spread to a wider economic magnitude. However, we can turn our eyes to the S&P 500 stock index (SPX), the asset class that Bitcoin and other cryptos have followed almost to a tee since their inception over a decade ago.
S&P 500’s next move is now critical for Bitcoin&
Although the S&P 500 index has recorded a robust rally since the bond yields’ topping on November 4, cryptocurrencies could not yet follow suit due to the ongoing FTX pandemonium. As a matter of fact, the S&P rallied by 5.5% on November 10, right after the crypto market’s collapse on November 9.&
Following last week’s stock market rally, the S&P index price is now pushing against four different major resistances:
- The resistance line of the current rising channel (the parallel orange lines in the chart below)
- 600-day simple moving average (the red line in the chart below)
- 200-day simple moving average (the blue line)
- Diagonal resistance line descending from the all-time high price (the yellow line)

Daily S&P price chart with the current major resistances. Source: Tradingview.
If the S&P cannot penetrate through the strong headwinds in the chart above, the bottom may not be in for Bitcoin yet as it could trigger a runaway from riskier assets.
Bitcoin’s possible price scenarios&
In terms of Bitcoin’s price action, $17,500 is the first resistance level in the short term if the alpha cryptocurrency starts an uptrend. $17,500 was the bottom price during the June crash and a local top during last week’s crash. Therefore, it is an important level to watch before opening new trade positions (see the chart below).
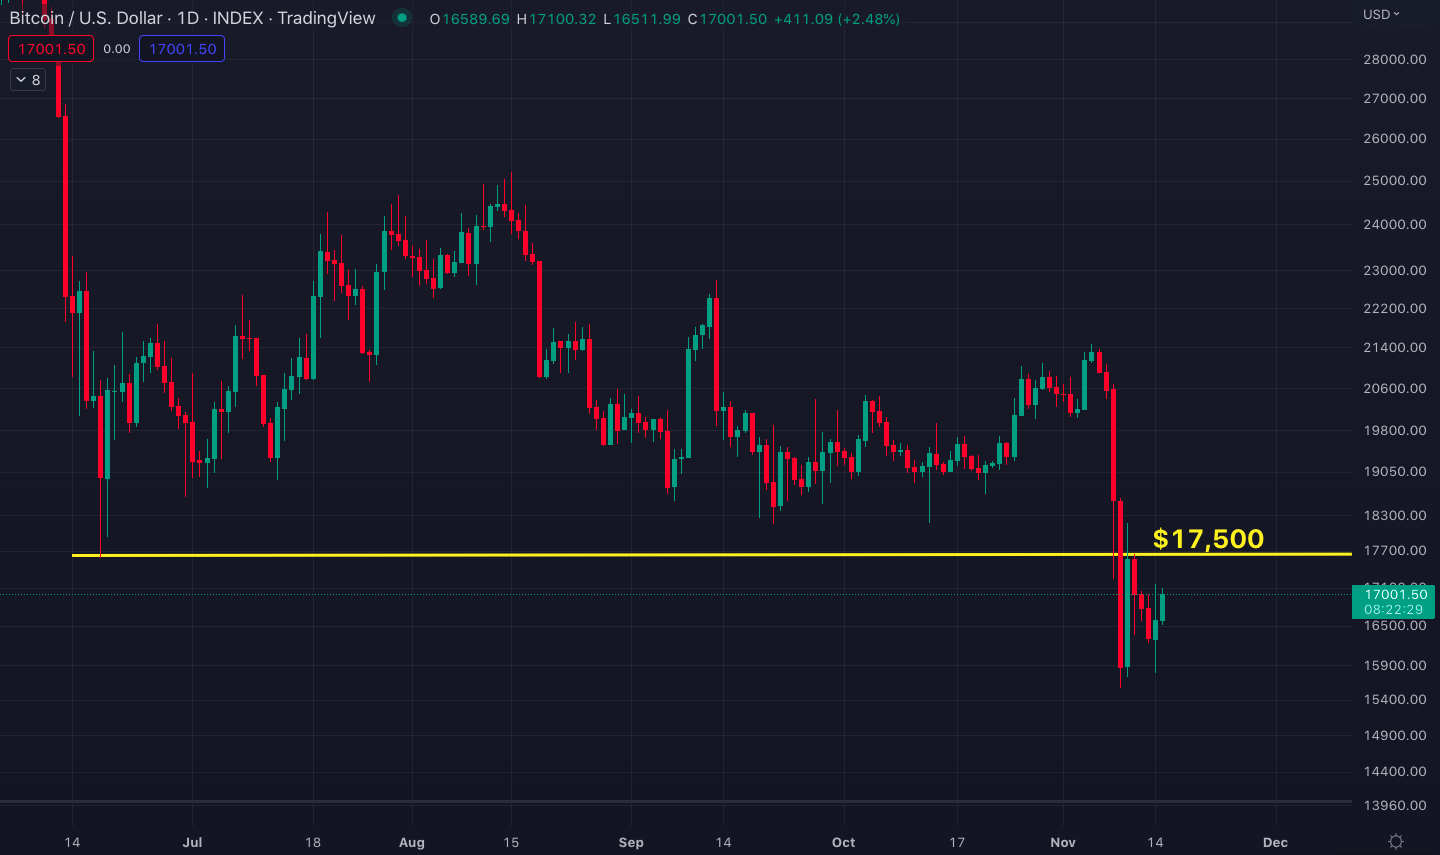
Bitcoin/U.S. dollar price chart with the $17,500 resistance.
In case of a further downtrend from current prices, $14,000 and $12,000 could be strong support levels as they constitute the monthly support from the previous cycle (see the chart below).& & & & & & & &

Bitcoin/U.S. dollar price chart with the monthly support levels at $14,000 and $12,000.
Bitcoin hash ribbons hint at an approaching bottom&
Bitcoin hash ribbons are an indicator that is made up of the 30 and 60-day simple moving averages of Bitcoin’s hash rate.&
Using the hash rate moving averages, the indicator tries to identify the periods when Bitcoin miners are in distress and may be capitulating. So, in that sense, hash ribbons are used to estimate the end of bear markets and the start of bull markets.&
In the past, hash ribbons were able to predict bear market bottoms, in addition to the most explosive bull runs, with surprising accuracy.&
In the weekly Bitcoin chart below, the green buttons on the Hash Ribbons indicator suggest miner capitulation, typically followed by blue Buy buttons. As you can observe in tandem with the price chart, the flashing of these buttons has historically signaled market bottoms that were eventually followed by huge rallies.&

Weekly Bitcoin chart with the Hash Ribbons indicator.
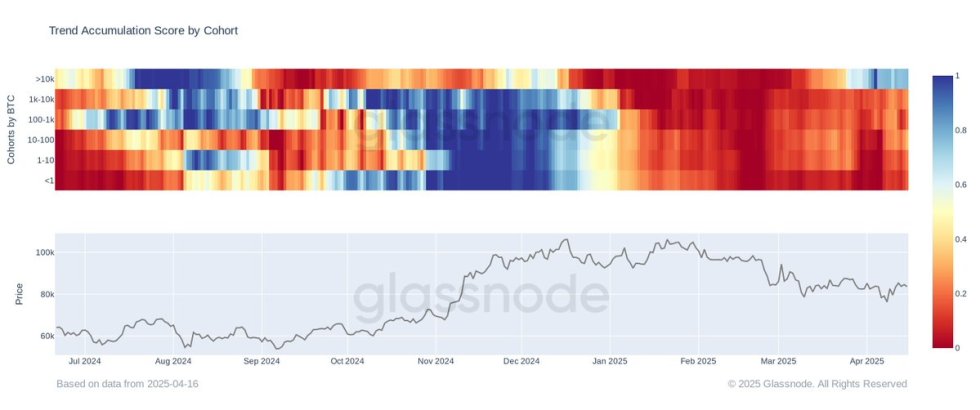
Long-term holder supply is still rising
Despite the recent discouraging developments, long-term Bitcoin holders are accumulating even more supply, let alone reducing their exposures (the orange line in the chart below).
This investor behavior could suggest that the larger players of the market are unaffected by the recent events, and in turn could carry little doubt about the fundamentals of this new asset class.& & &
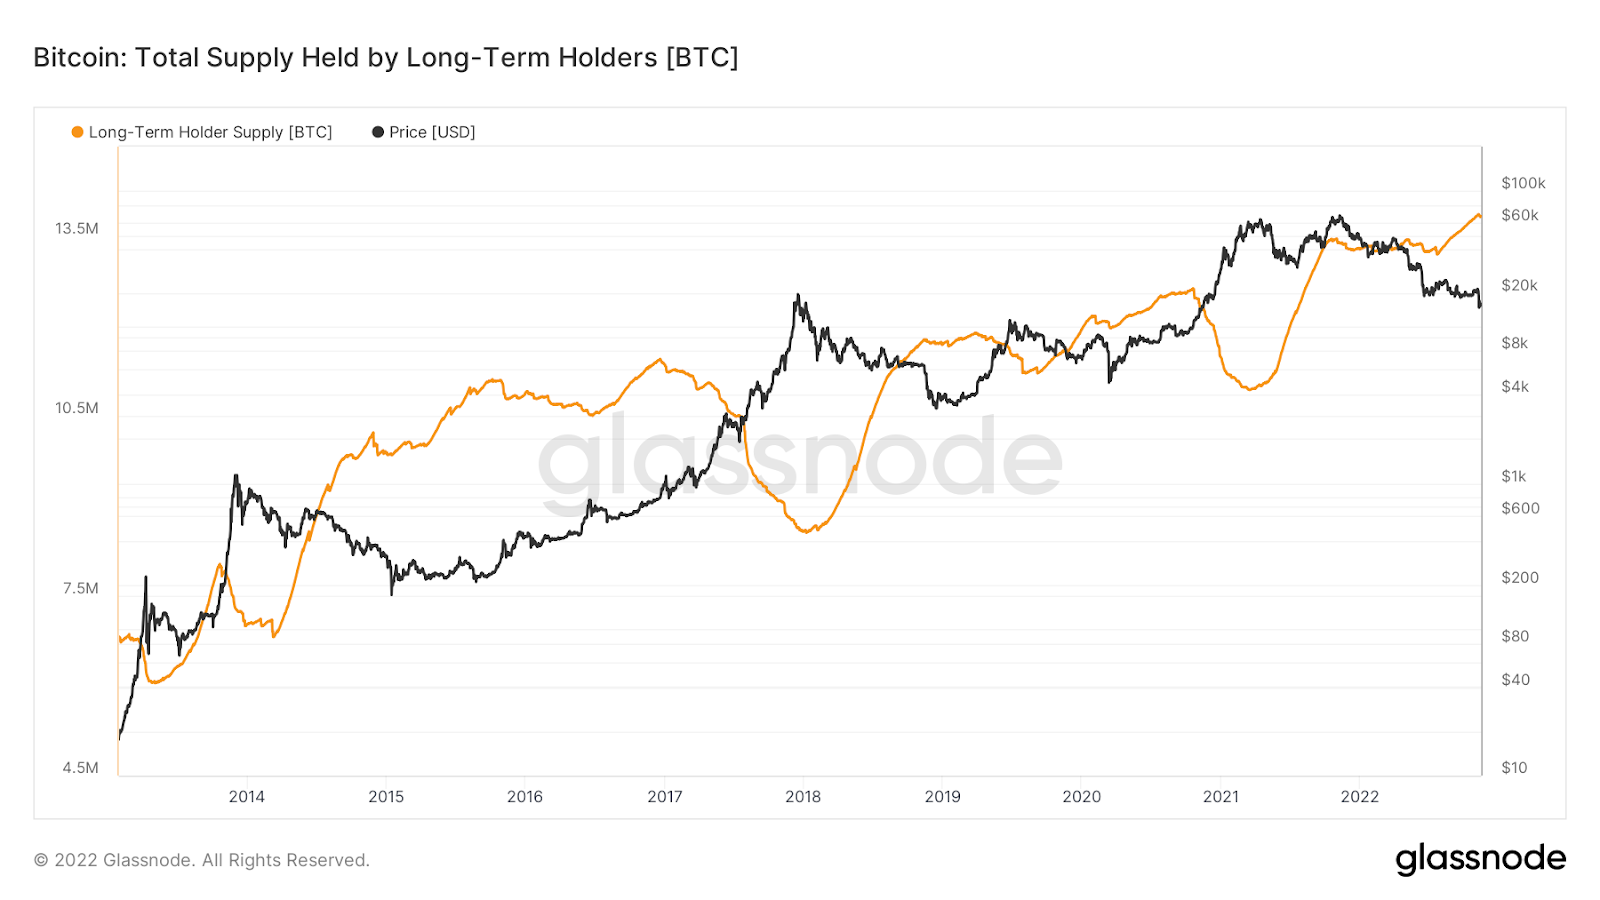
As you can observe in the chart above, the Bitcoin supply held by long-term holders typically rises during capitulation periods as observed in the 2015, 2018, and 2020 market bottoms. The supply was similarly increasing during last week’s crash, which represents a divergence from the overall market sentiment.
Hash ribbon signals, along with the consistent rise in the long-term supply, could indicate that Bitcoin could be approaching the cycle bottom price.& & &
Cryptos that benefited from FTX’s collapse
Not all cryptocurrencies cratered in the wake of the FTX crisis. Crises often come with their opportunities, and this time it was the decentralized wallets and exchanges that benefited.& & & & & & & & &
Escalating fears about storing funds in centralized exchanges have motivated many people to move their funds to decentralized storage, which caused the price of decentralized wallet and exchange tokens to soar.&
dYdX Exchange (DYDX) and Trust Wallet (TWT) have been the biggest beneficiaries of this trend so far, with the DYDX token recording a 130% gain and TWT recording a 175% gain right after the November 9 market crash (see the charts below).

DYDX price chart with the Tether trading pair.
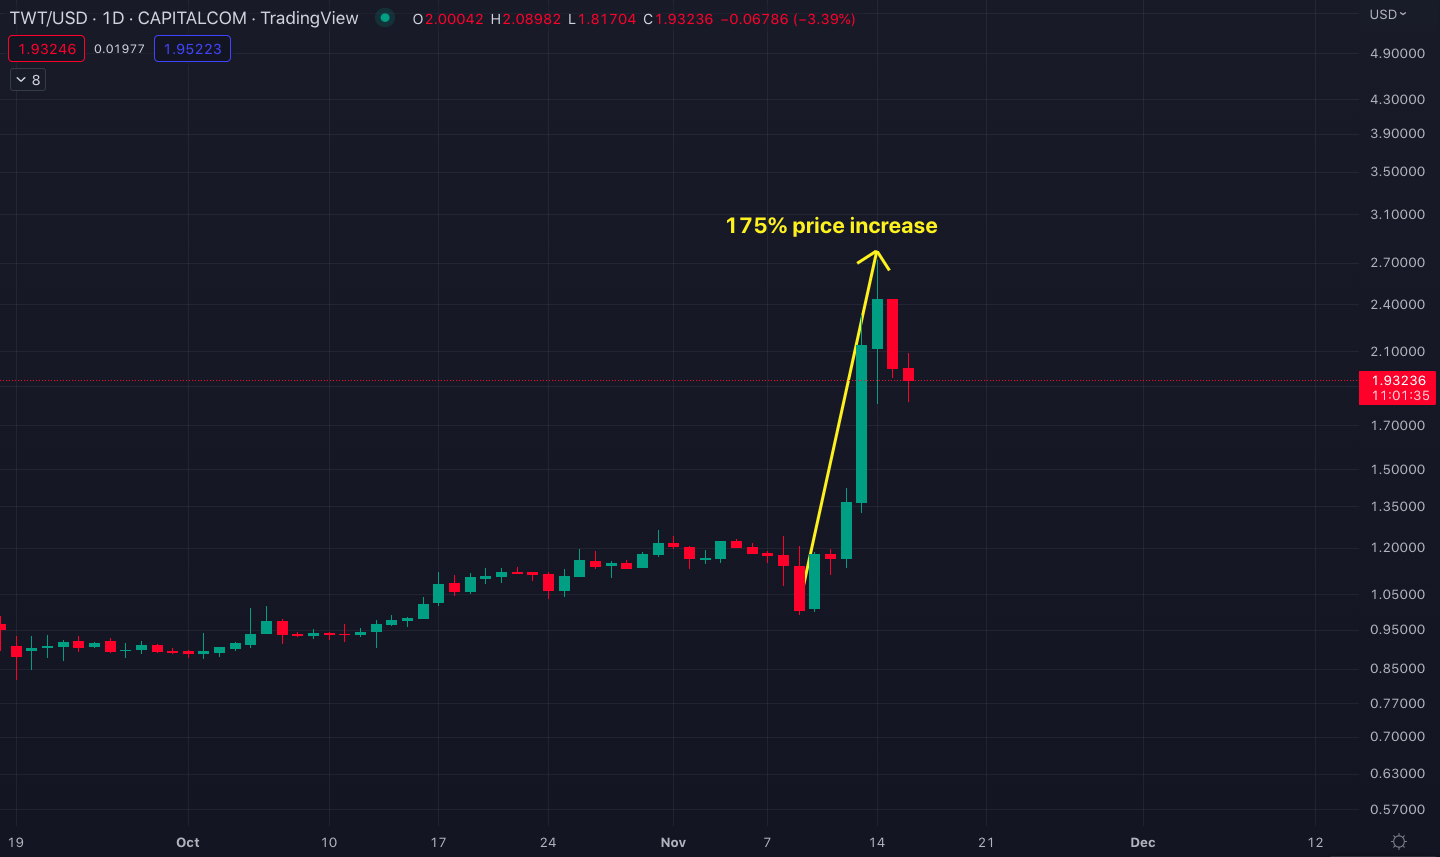
TWT/U.S. dollar price chart with the recent price spike.
dYdX is a decentralized exchange (DEX) platform that offers perpetual trading options for over 35 popular cryptocurrencies including Bitcoin, Ethereum, Dogecoin, and Cardano.&
Trading volume on the platform surged when the demand for DEXes exploded last week. This translated to the price of DYDX, the native governance token of the dYdX platform, increasing by over 100%.&
You can buy the DYDX token on CEX.IO, either on the CEX.IO website or on the CEX.IO Exchange App.
On the other hand, Trust Wallet is a non-custodial crypto wallet app that gives users full custody over their digital assets, from cryptocurrencies to non-fungible tokens (NFTs). TWT is a BEP-20 utility token that provides a range of benefits and incentives to Trust Wallet users.&
The move from centralized exchanges to Trust Wallet caused a similar spike in the price of TWT.&
TWT is also available on CEX.IO with the USD trading pair.
Tune in next week, and every week, for the latest CEX.IO crypto ecosystem update. For more information, head over to the Exchange to check current prices, or stop by CEX.IO University to continue expanding your crypto knowledge.
Disclaimer: Information provided by CEX.IO is not intended to be, nor should it be construed as financial, tax or legal advice. The risk of loss in trading or holding digital assets can be substantial. You should carefully consider whether interacting with, holding, or trading digital assets is suitable for you in light of the risk involved and your financial condition. You should take into consideration your level of experience and seek independent advice if necessary regarding your specific circumstances. CEX.IO is not engaged in the offer, sale, or trading of securities. Please refer to the Terms of Use for more details.

You can get bonuses upto $100 FREE BONUS when you:
💰 Install these recommended apps:
💲 SocialGood - 100% Crypto Back on Everyday Shopping
💲 xPortal - The DeFi For The Next Billion
💲 CryptoTab Browser - Lightweight, fast, and ready to mine!
💰 Register on these recommended exchanges:
🟡 Binance🟡 Bitfinex🟡 Bitmart🟡 Bittrex🟡 Bitget
🟡 CoinEx🟡 Crypto.com🟡 Gate.io🟡 Huobi🟡 Kucoin.


Comments