This weekly piece of cryptocurrency price analysis and thought leadership is brought to you by the expert team at CEX.IO, your crypto guide since 2013. At CEX.IO, we’re committed to providing the latest industry developments and potential price scenarios to help our users make the most informed decisions along their crypto journeys.&
In this week’s update, we discuss the asset class that could determine Bitcoin’s next move in the immediate short term.&
We also analyze how Litecoin rallies of the past have preceded major Bitcoin bull runs, in light of the recent hype around the original Bitcoin fork.
Additionally, the 41st edition of our Crypto Ecosystem Update includes recent price reviews of Dogecoin (DOGE), Chainlink (LINK), and Curve (CRV).
Read along for in-depth breakdowns and enjoy reviews of correlated markets to help you make the most informed decisions along your crypto journey.
S&P 500 could trigger the next big wave
The S&P 500 stock index, the asset class that Bitcoin has been most closely correlated with, has hit four different major resistances as of late:
- The upper resistance line of the rising channel (the parallel orange lines in the chart below).
- 600-day simple moving average (the red line in the chart below).
- 200-day simple moving average (the blue line).
- Diagonal resistance line descending from the all-time high price (the yellow line).
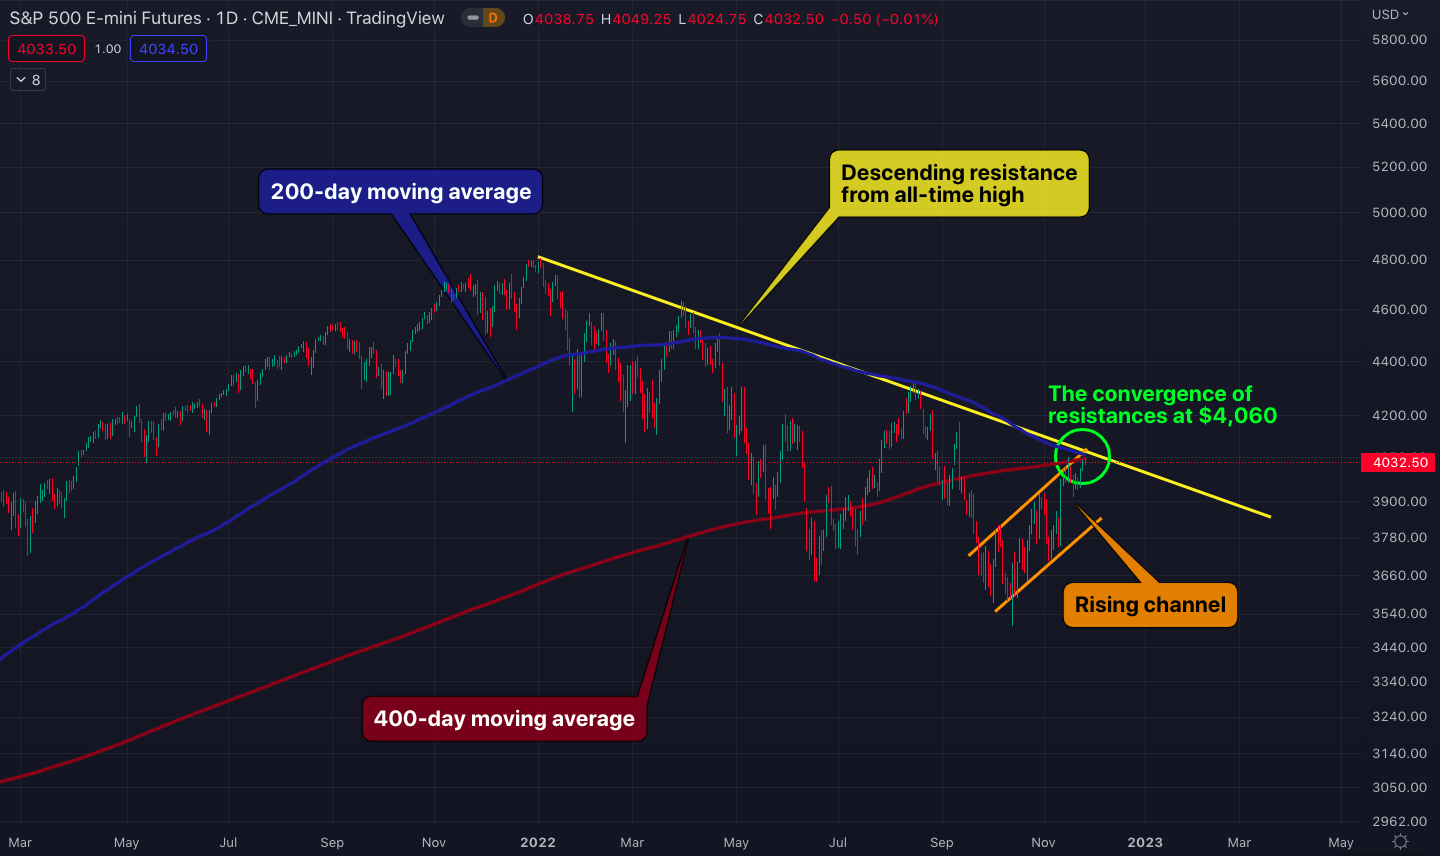
Daily S&P chart with the convergence of four major resistances. Source: Tradingview.
Whether the S&P could blow past all these strong resistances is a hotly stirred debate right now among financial analysts. The release of the second estimate for the Q3 U.S. gross domestic product (GDP) on Wednesday, November 30, and of the U.S. unemployment figures on Friday, December 2 could dictate the S&P’s next major move.
If a downtrend starts this week following the data releases, BTC could lose the previous $15,475 low from last week.&
Inverse head & shoulders on the Bitcoin chart&
Bitcoin’s V-shaped recovery following the $15,475 bottom is potentially evolving into an inverse head and shoulders pattern, with the V bottom forming the head.&
An inverse head and shoulders is a reversal pattern which can happen at the end of a downtrend. If the pattern plays out, BTC could break out of the diagonal resistance at $16,600 (the yellow line in the chart below), which coincides with the neckline resistance of the ongoing inverse head and shoulders formation.
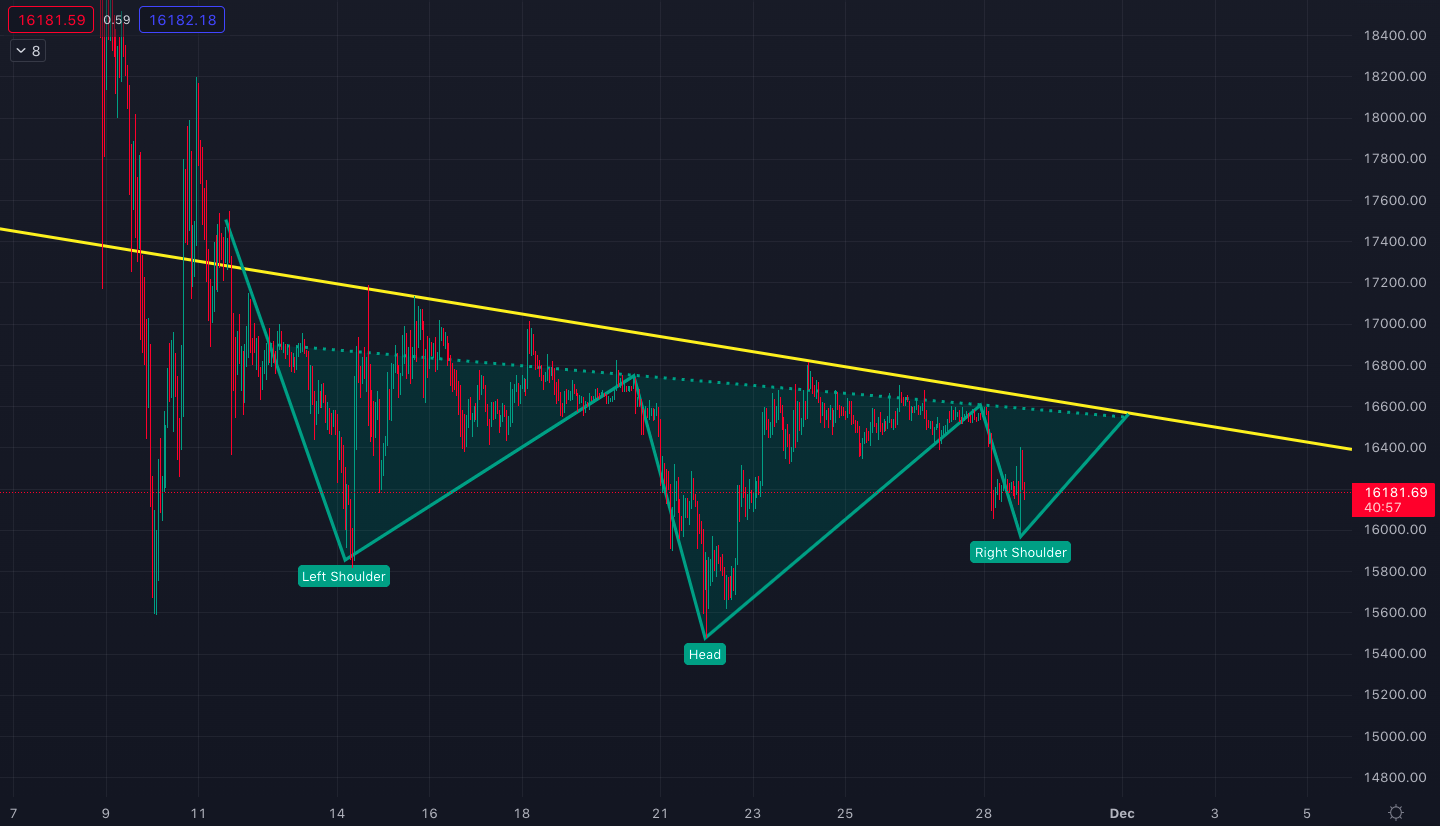
Bitcoin/U.S. dollar chart with the potential inverse head and shoulders formation.
Even if there are more downtrends in the long term, BTC could first march to the $18,500 resistance if it breaks out of both the diagonal resistance and the inverse head and shoulders pattern (see the charts below).
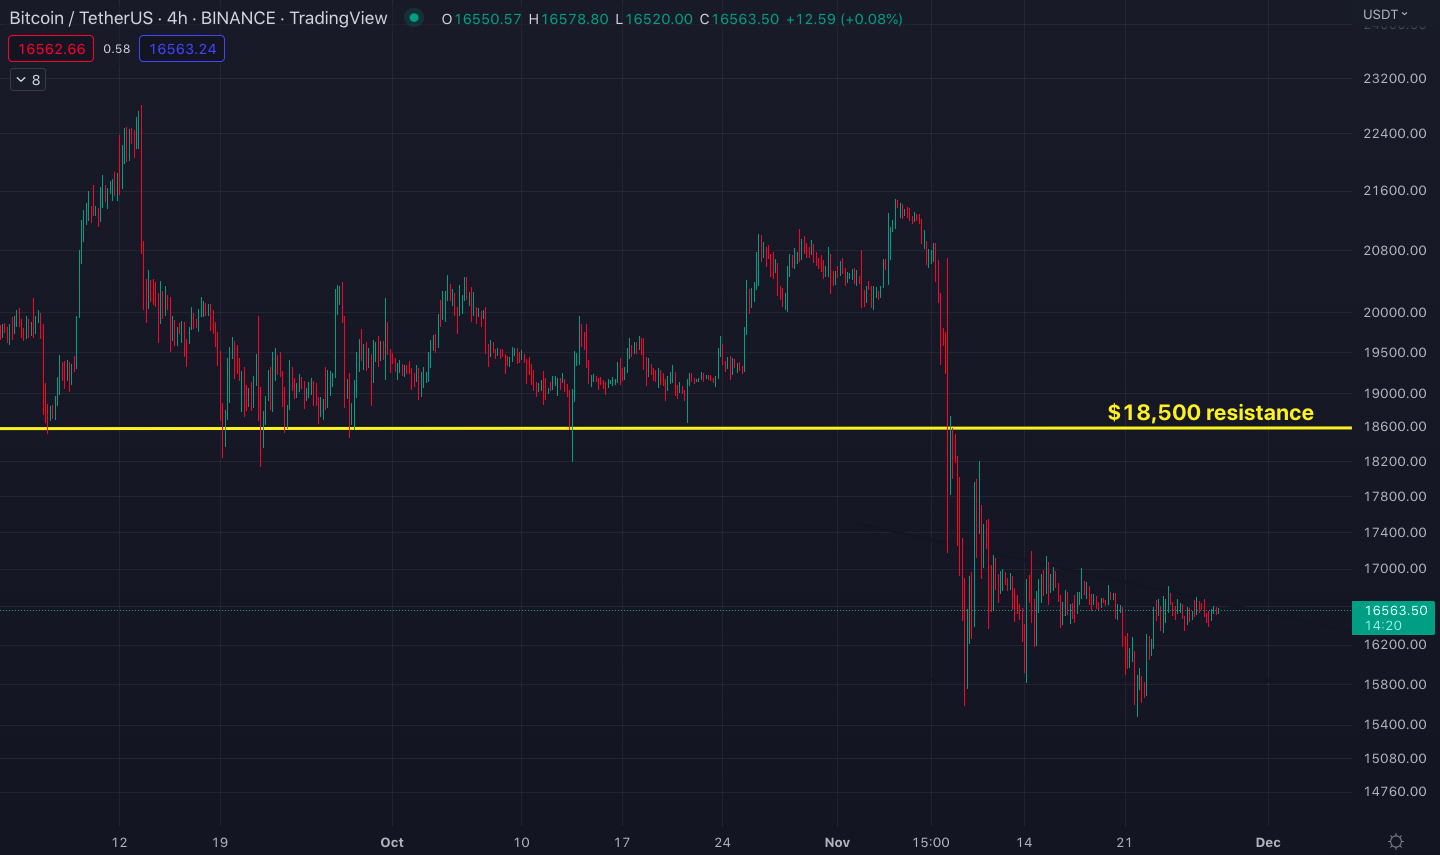
BTC/USD price chart with the $18,500 resistance.&
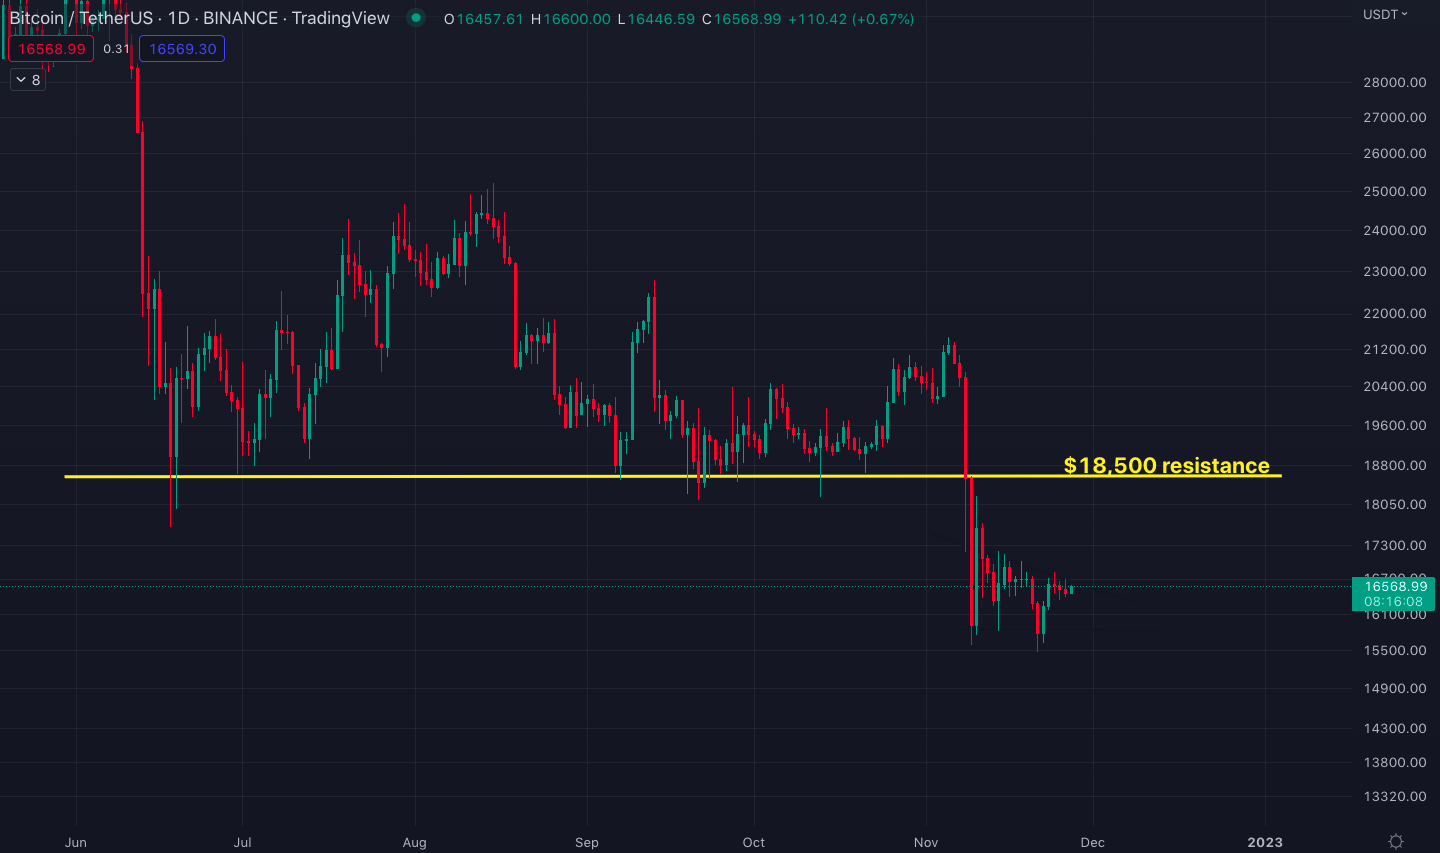
View of the $18,500 resistance on the daily time frame.
On the other hand, it is worth noting that Bitcoin is struggling against the 100 simple moving average in the 4-hour time frame, a commonly observed moving average by traders for the short-to-mid term (see the chart below).
BTC has failed to consistently close above this moving average line since breaking down from it on August 17. A decisive close above the line on the 4-hour time frame (read: multiple candles above the line) could bring the necessary momentum to take Bitcoin to the $18,500 resistance.
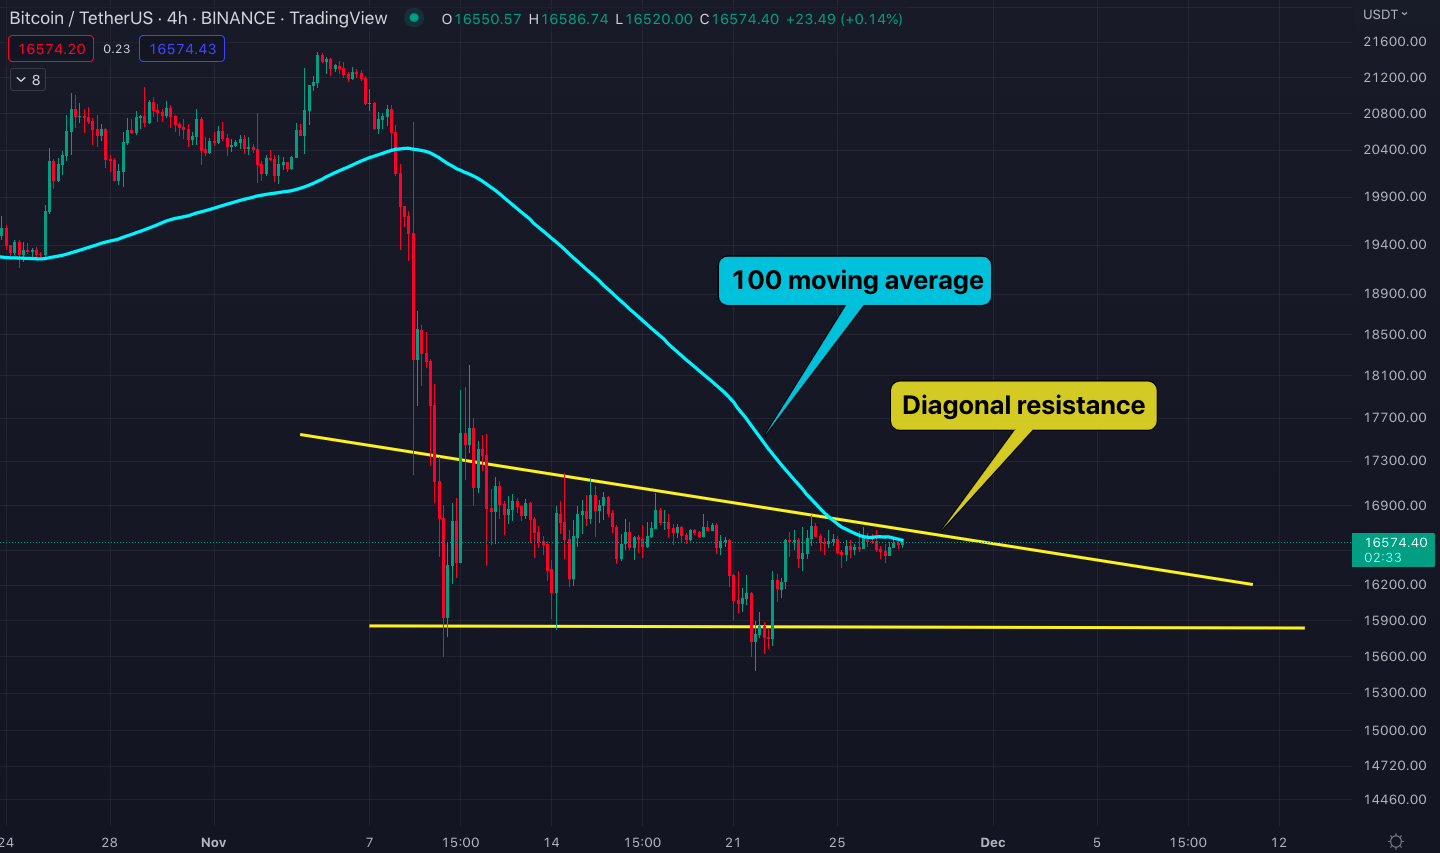
4-hour BTC/USD chart with the 100 simple moving average line.&
Is Litecoin preparing for something big?
Litecoin’s early popularity has waned throughout the years, as it became overshadowed by newer projects and product use cases since the last bull market.&
The original altcoin remained silent for a while until finally exploding out of its slumber in November.&
Litecoin (LTC) initiated its uptrend at the beginning of November from the $50 level, but was interrupted by the FTX debacle, and temporarily retraced to where it began with a double bottom.
However, it started climbing back again following the November 10 market bottom with the price exploding on November 22 and November 23, after reaching a high of $85 (see the chart below).
The rally could be credited to the upcoming Litecoin Halving event scheduled in eight months.&
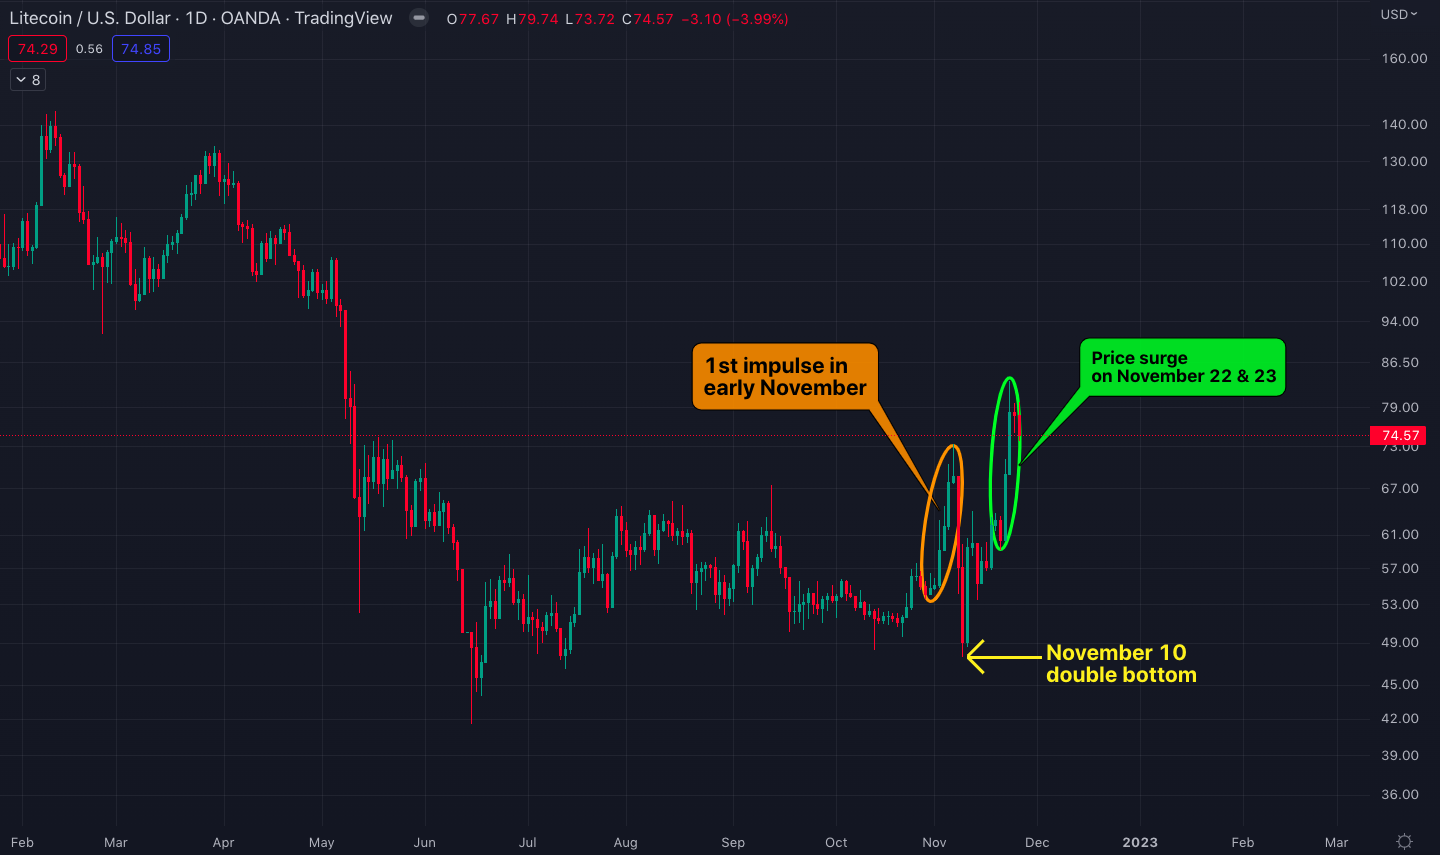
Litecoin/U.S. dollar chart with the recent price action.
In the past, Litecoin bull runs have often preceded major Bitcoin rallies, so this recent hype around LTC could help excite the market (see the chart below).
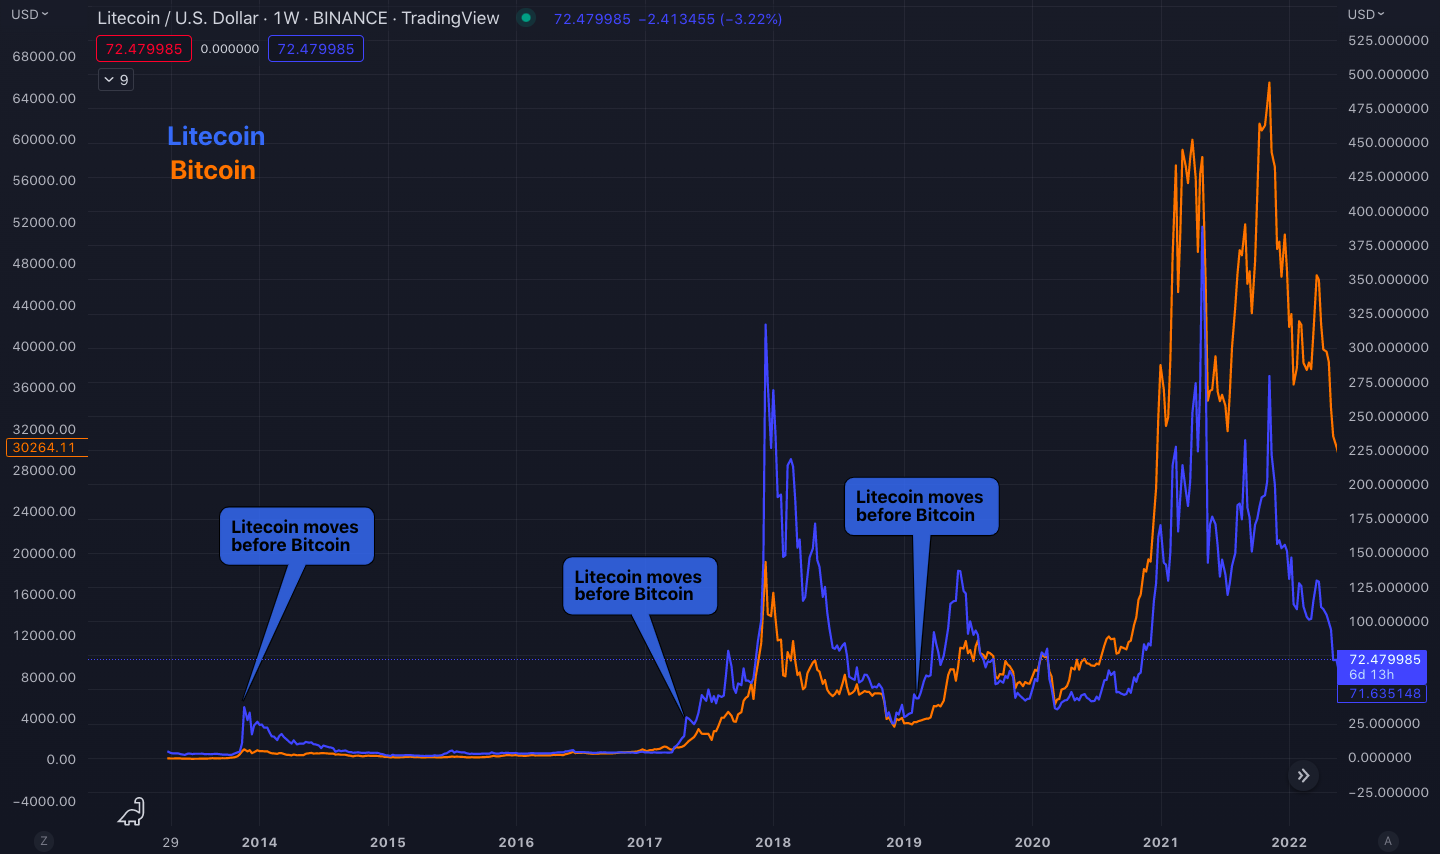
Historical Litecoin (blue) and Bitcoin (orange) price charts on a weekly scale.
The chart above shows the three instances where Litecoin acted as a precursor for upcoming bull markets by moving slightly before Bitcoin.
For LTC to remain bullish would require a December close above its historical accumulation zone, boxed in yellow in the chart below.
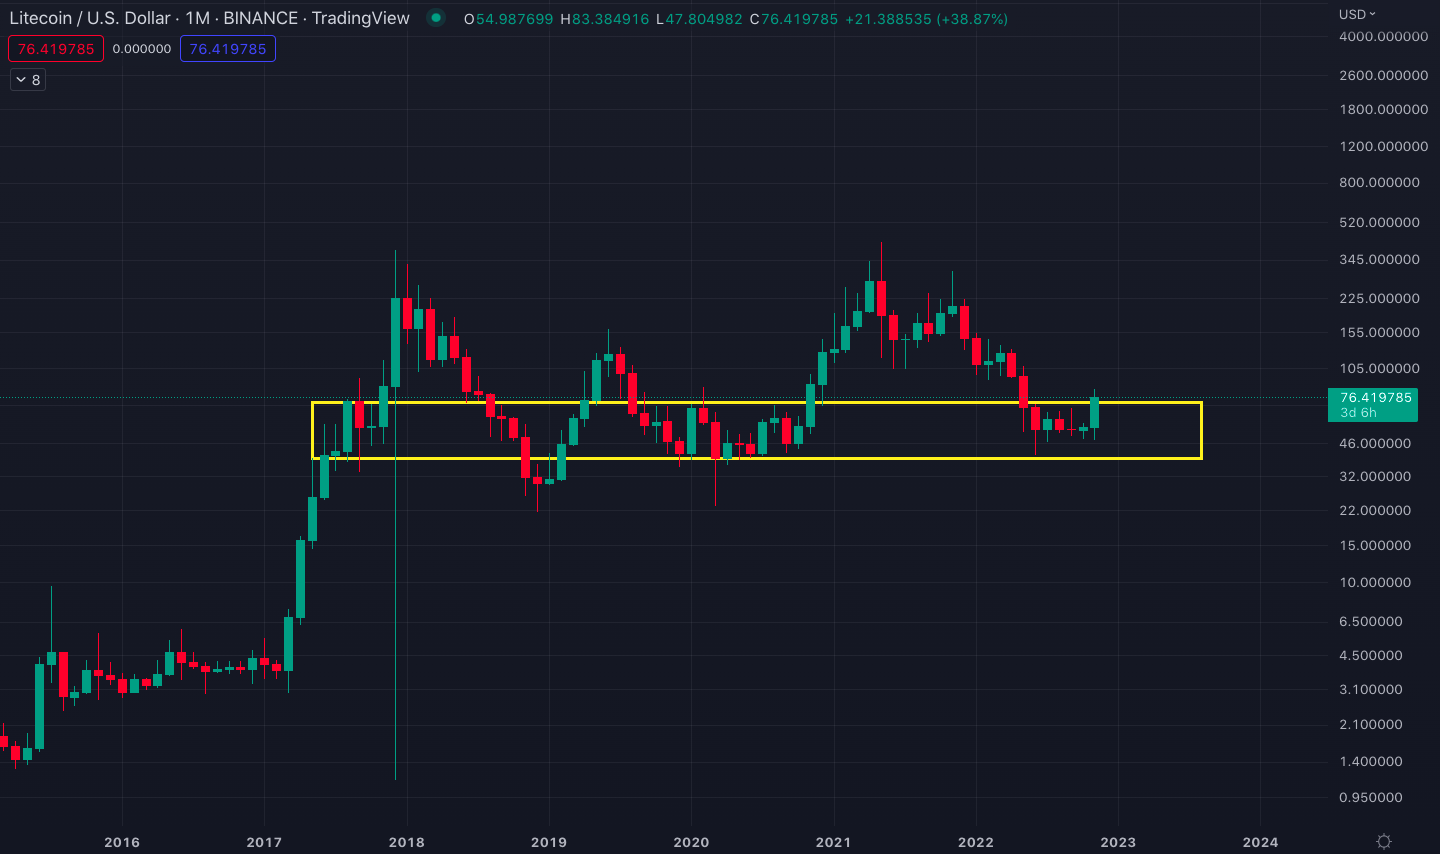
Historical accumulation zone on the monthly Litecoin chart.
A monthly close above the yellow box could also take Litecoin’s monthly relative strength index (RSI) above the historical 44 resistance. In return, this could help reinforce potential uptrends since RSI movements over longer time frames often preceded these actions.
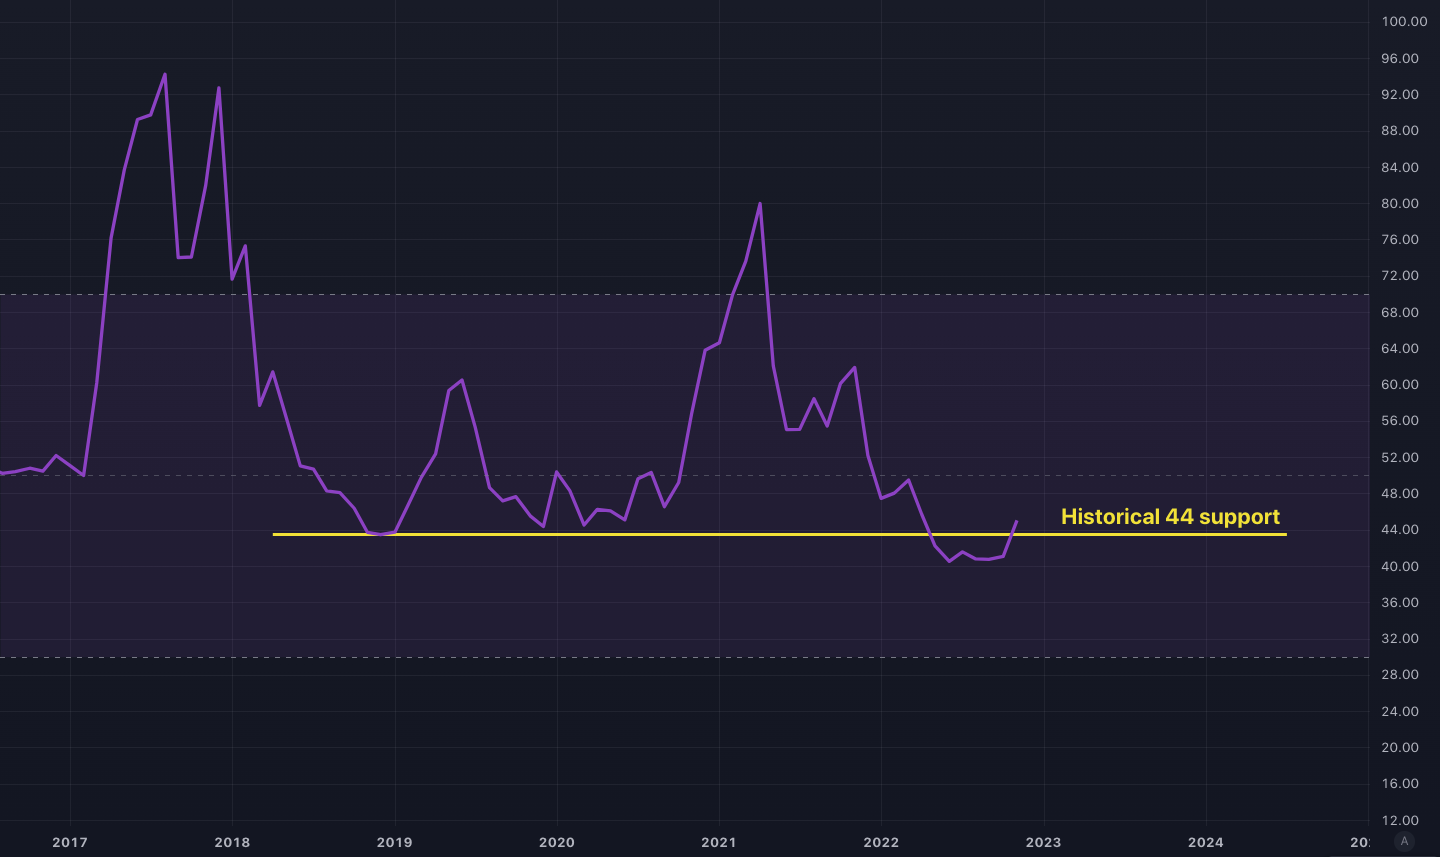
Monthly RSI chart for the LTC/USD trading pair.
However, if these conditions fail, Litecoin could remain oversold as long as its price remains inside the yellow accumulation box and the monthly RSI remains below 44.
Dogecoin rallied with strong momentum
After losing most of its price gains from Elon Musk’s Twitter deal, Dogecoin (DOGE) bounced with a vengeance last week from a low of $0.07 to a high of $0.11.&
So far, the bounce has hit the 0.382 Fibonacci retracement level, which is a common profit-taking place for traders during substantial bounces (see the chart below).
Considering this, DOGE could require new announcements and/or developments to make it past the 0.382 Fibo level. Otherwise, profit-taking could dominate the game and take the price back down to its $0.07 lows.&
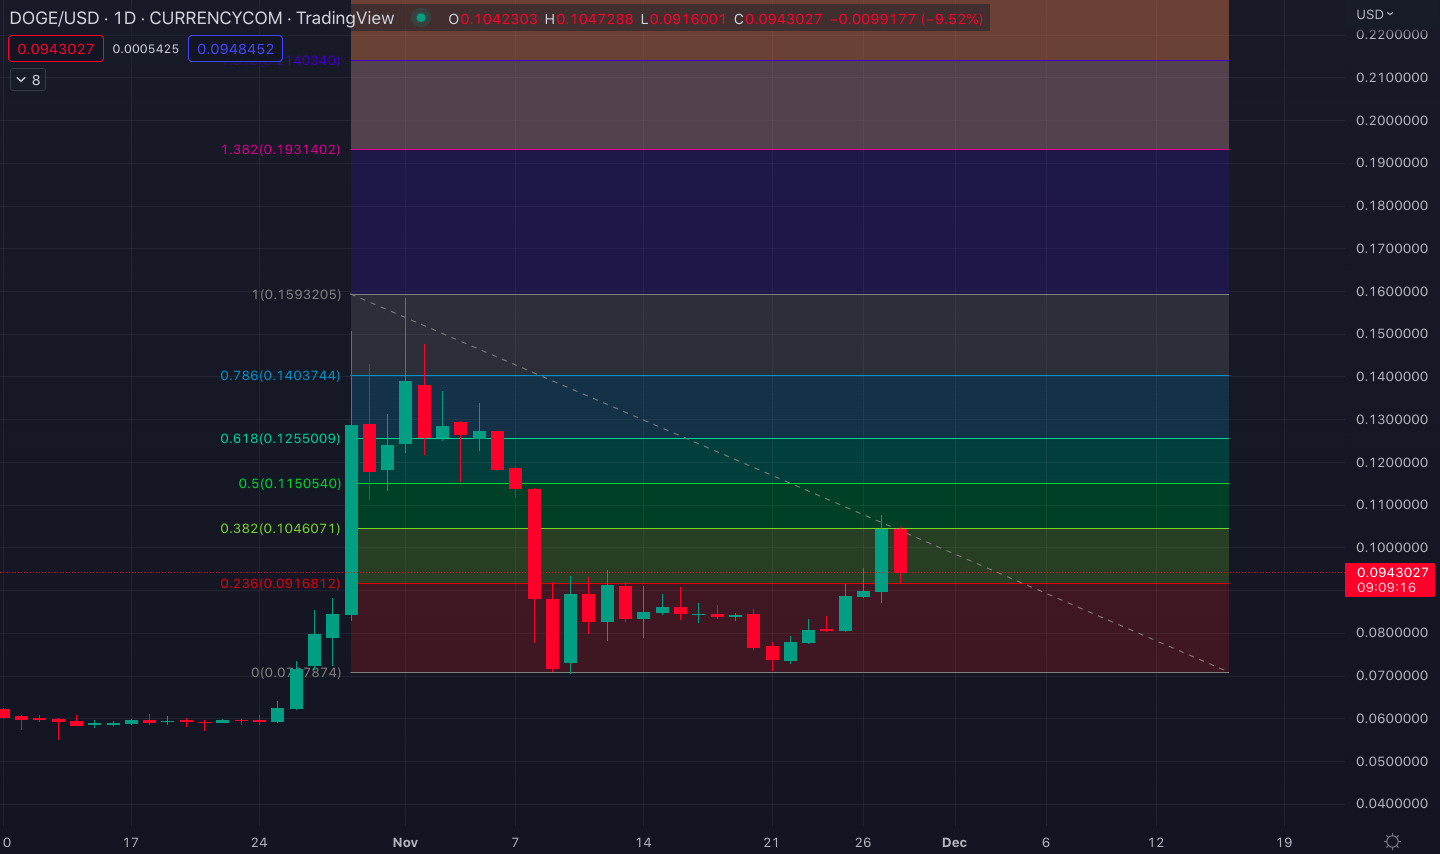
Dogecoin/U.S. dollar chart with the recent rejection at 0.382 Fibo level.
As evidenced time and again, the original meme currency is generally motivated by Musk’s unexpected tweets. Therefore, his Twitter account could be the key to understanding whether DOGE has the momentum to penetrate the 0.382 Fibonacci level.
Chainlink is showing signs of strength
Chainlink (LINK) managed to hold its long-term $5.5 support during the November 21 market sell-off and has shown exceptional strength since then (see the chart below).

Chainlink/U.S. dollar price chart with the recent move from $5.5 to $7.5.
The early-November pump in Band Protocol (BAND), another major data oracle application, could have been the precursor to LINK’s recent momentum as cryptocurrencies of the same product category have a tendency to move together.&
Back on November 3 and 4, BAND suddenly surged by 200% from $1.2 to a high of $3.6 (see the chart below).
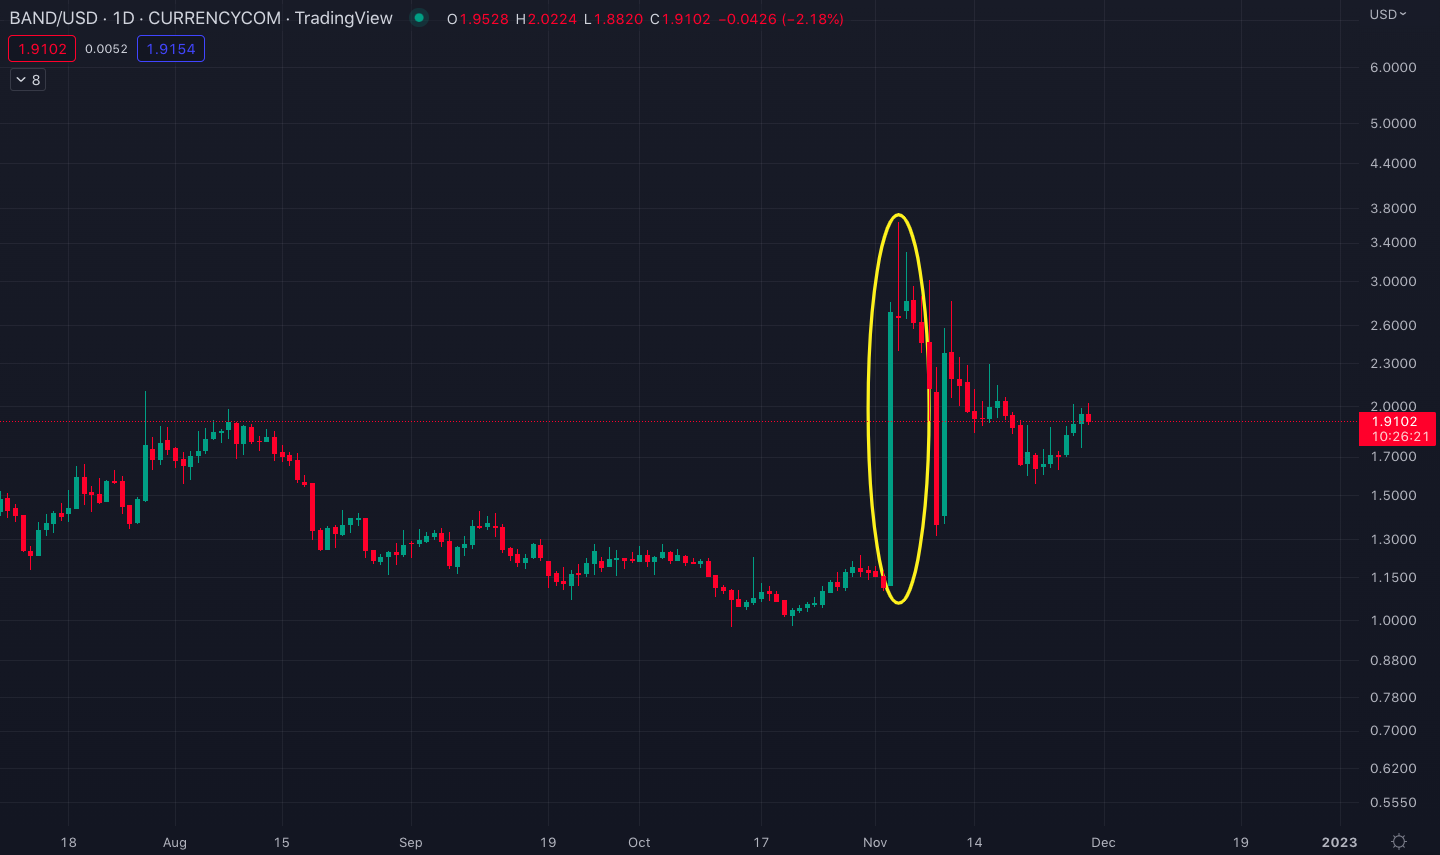
The 200% rally in the BAND/USD trading pair.
If the Band Protocol’s performance is any indication, Chainlink could be on the verge of a sustained uptrend – depending of course on Bitcoin’s price movements.&
On the other hand, the staking feature of Chainlink is expected to go live on December 6, which could be an additional catalyst for the price action.
As further confluence, the bullish long-wick daily candle printed on November 28 (circled in yellow in the chart below) suggests a continued uptrend in the price of LINK.

Bullish long-wick candle printed on November 28.
If Chainlink continues its recent uptrend, $9.5 will be the key resistance to break as that level constitutes the top of the horizontal channel that LINK has followed since its June low (see the chart below).
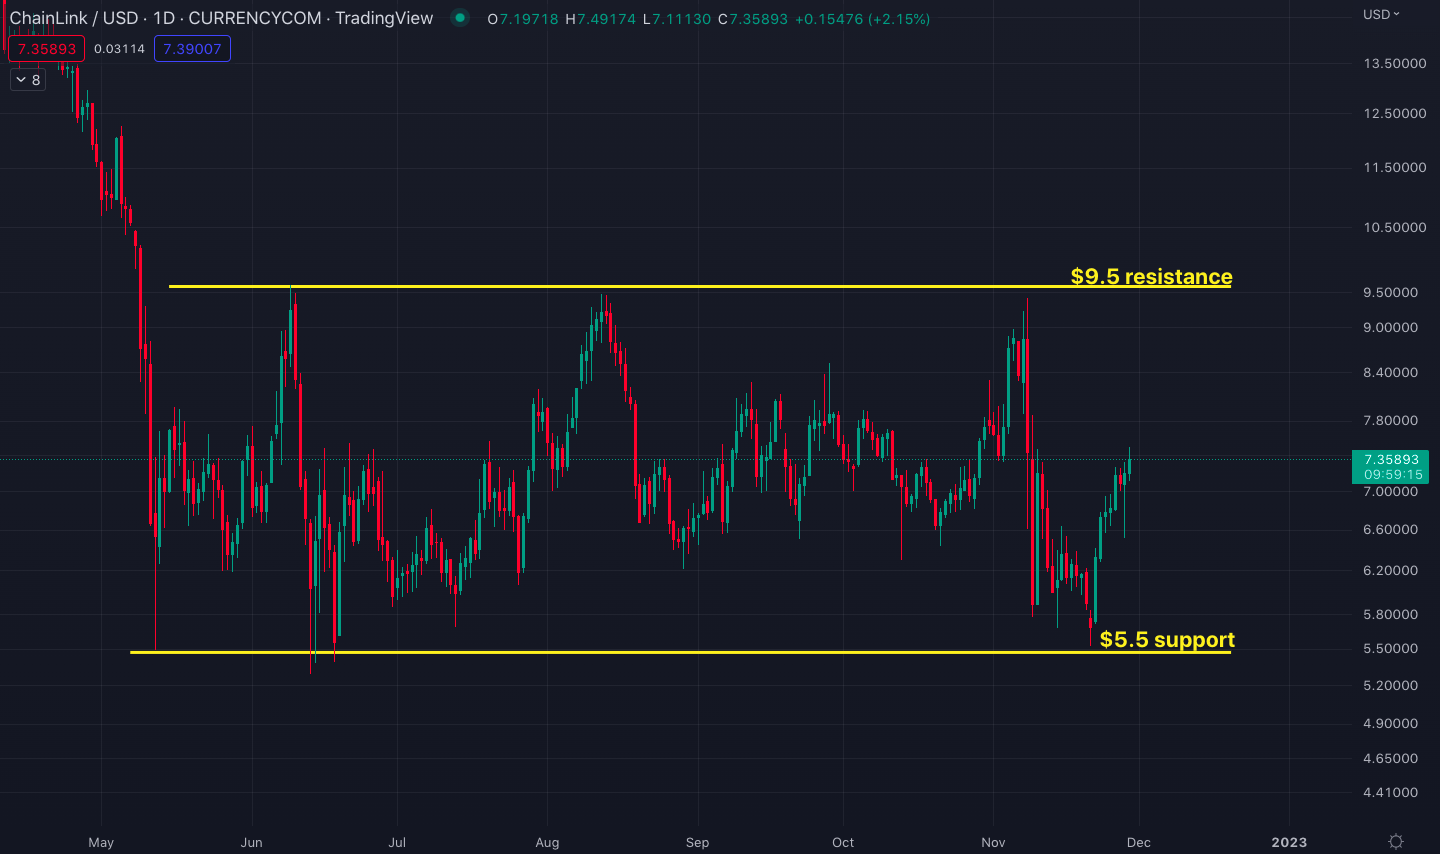
LINK/USD chart with the long-term horizontal channel.
However, a failure to close above $9.5 at the year’s end could mean a continuation in the macro downtrend. Such an eventuality could cause LINK to retrace to the bottom of the horizontal resistance.
Curve shorter was punished
Avraham Eisenberg, a trader who became infamous for exploiting $117 million from Mango Markets, borrowed 40 million Curve DAO tokens (CRV) last week from the decentralized lending platform, Aave, and then dumped them on the OKX crypto exchange.
His purpose was to allegedly make a profit, as he had previously opened a short position on the Curve platform worth $17 million.
However, things didn’t go as planned and Eisenberg’s CRV loan ended up liquidating, leaving Aave with $1.6 million of bad debt.
Although the price of CRV had initially crashed from $0.60 to a low of $0.40 on November 22, Curve whales soon took notice of the excessive selling activity and stepped in to stop Eisenberg. By heavily buying the token, users managed to increase CRV’s value by 90% to a high of $0.75 (see the chart below).
The pump from $0.40 to $0.75 eventually liquidated Eisenberg’s CRV loan.&
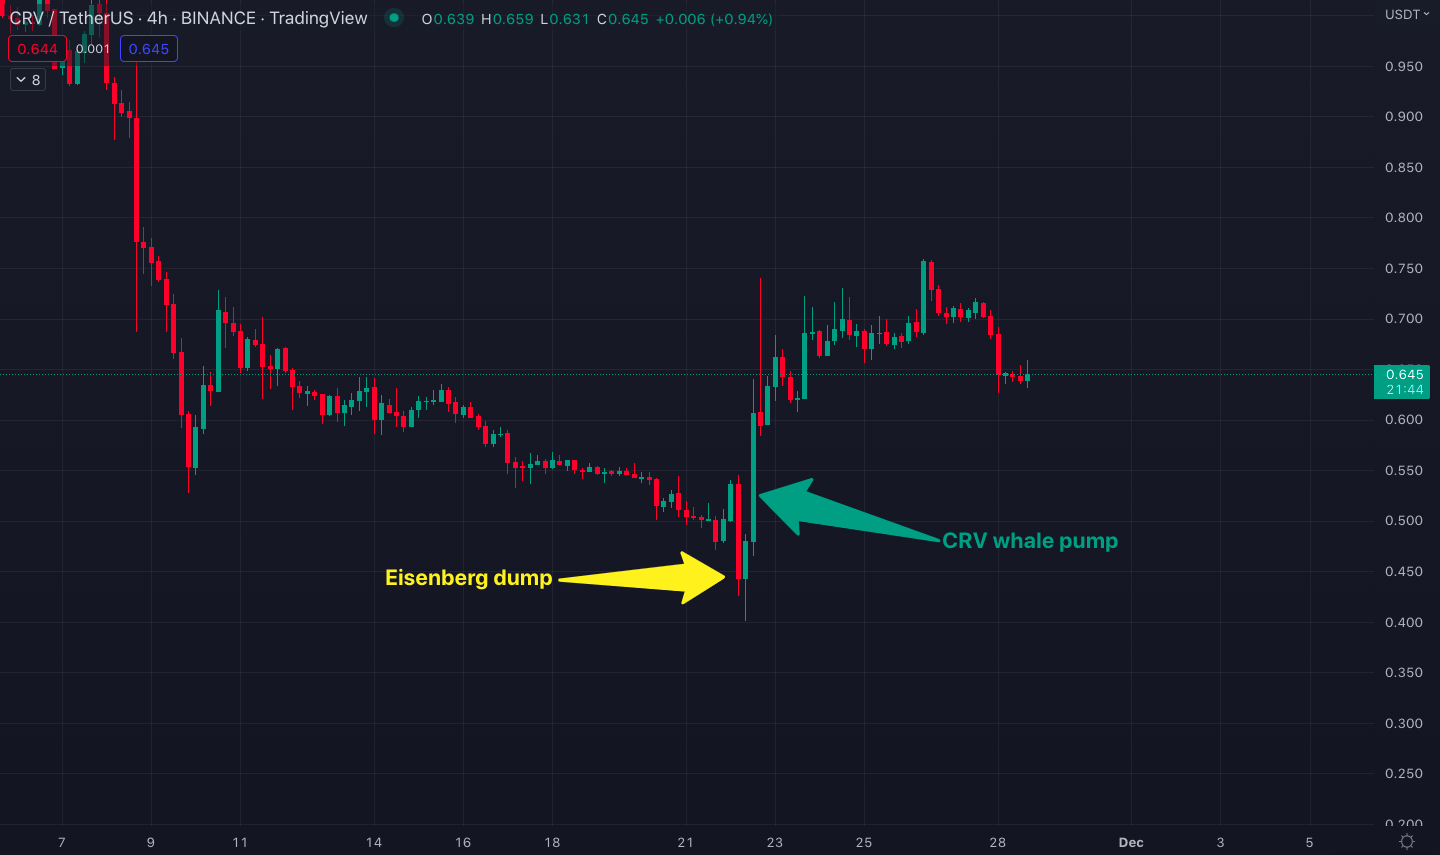
Curve/U.S. dollar chart with the dump and pump on November 22.
To continue its recently-gained momentum, CRV would need to flip $0.80 back to support (see the chart below).&

CRV/USD chart with the $0.80 horizontal resistance.
Tune in next week, and every week, for the latest CEX.IO crypto ecosystem update. For more information, head over to the Exchange to check current prices, or stop by CEX.IO University to continue expanding your crypto knowledge.
Disclaimer: Information provided by CEX.IO is not intended to be, nor should it be construed as financial, tax or legal advice. The risk of loss in trading or holding digital assets can be substantial. You should carefully consider whether interacting with, holding, or trading digital assets is suitable for you in light of the risk involved and your financial condition. You should take into consideration your level of experience and seek independent advice if necessary regarding your specific circumstances. CEX.IO is not engaged in the offer, sale, or trading of securities. Please refer to the Terms of Use for more details.

You can get bonuses upto $100 FREE BONUS when you:
💰 Install these recommended apps:
💲 SocialGood - 100% Crypto Back on Everyday Shopping
💲 xPortal - The DeFi For The Next Billion
💲 CryptoTab Browser - Lightweight, fast, and ready to mine!
💰 Register on these recommended exchanges:
🟡 Binance🟡 Bitfinex🟡 Bitmart🟡 Bittrex🟡 Bitget
🟡 CoinEx🟡 Crypto.com🟡 Gate.io🟡 Huobi🟡 Kucoin.


Comments