Is the latest Ethereum rally a bull trap or the start of a fresh bull market? Here’s what the ETH-taker buy-sell ratio says about it.
Ethereum Taker Buy/Sell Ratio Has Fallen Below 1 Recently
An analyst in a CryptoQuant post pointed out that the recent sentiment has been bearish according to the metric. The “taker buy-sell ratio” is an indicator that measures the ratio between the taker buy and taker sell volumes in the Ethereum futures market.
When the value of this metric is greater than 1, it suggests the “long” or the taker buy volume is higher than the “short” or the taker sell volume currently. Such a trend means more buyers are willing to acquire cryptocurrency at a higher price.
On the other hand, values of the ratio less than the threshold imply the taker sell volume is the more dominant volume in the futures market. Thus a bearish sentiment is shared by the majority at the moment.
Now, here is a chart that shows the trend in the 30-day simple moving average (SMA) Ethereum taker buy-sell ratio over the last few years:
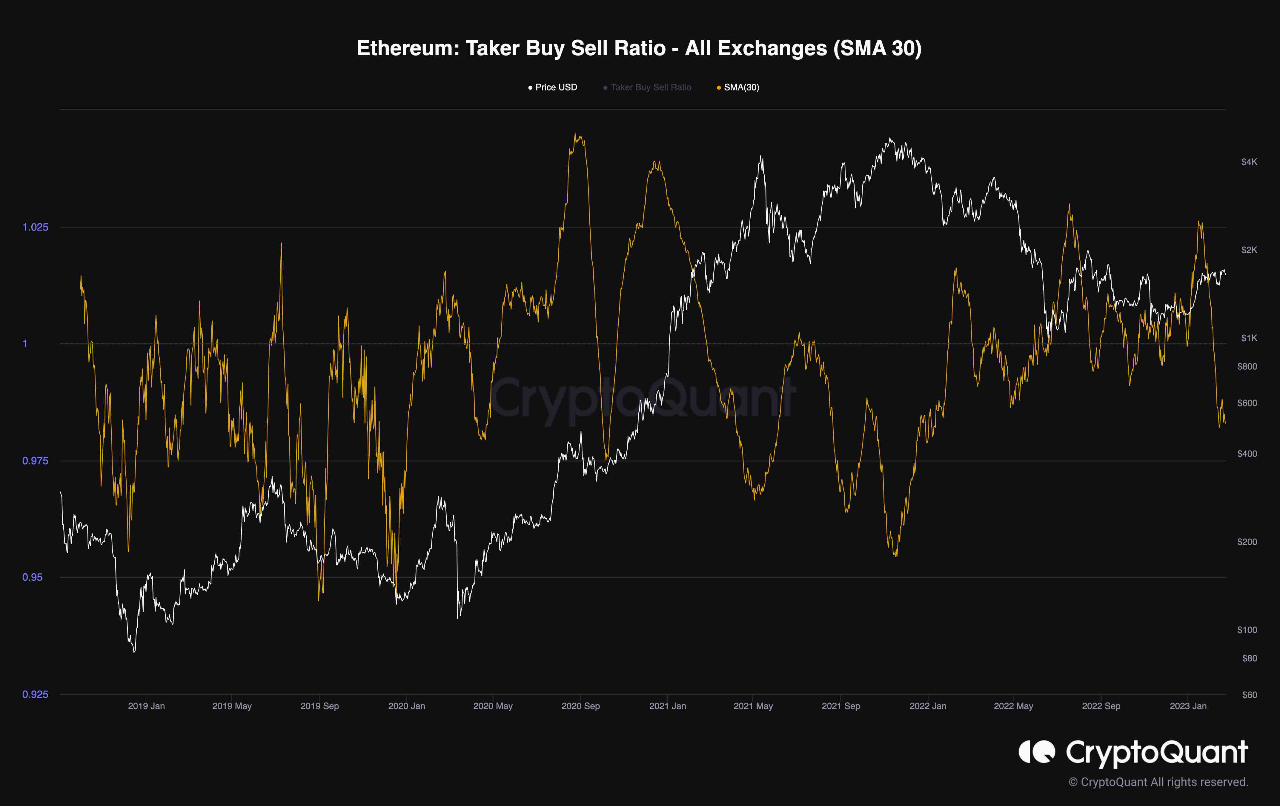
As displayed in the above graph, the 30-day SMA Ethereum taker buy-sell ratio had shot above the 1 line with the latest rally in the asset price.
This means that the majority sentiment in the ETH futures market had turned bullish as the coin’s value rose. However, the indicator’s value dropped when the rally slowed, and the price moved sideways.
The taker buy-sell ratio decline continued, and the metric soon plunged below the one mark. This implies that the short volume dominated the futures market following the consolidation.
The metric hit a low recently that had just been seen a year ago. From the chart, it’s apparent that with the latest leg up in the rally, the metric hasn’t shown any significant increases in its value, and the dominant sentiment is still bearish.
Historically, the cryptocurrency has usually encountered tops whenever the 30-day SMA taker buy-sell ratio has assumed such bearish values. A prominent example visible in the graph is the November 2021 bull run top (that is, the current all-time high price), which formed with values of the metric deep below the one mark.
The metric’s current value isn’t as underwater as then, so it could still see some recovery in the coming days as the sentiment might turn bullish again with the rally continuing.
However, the quant cautions:
(…) the recent rally should be closely monitored in the weeks ahead to determine whether this was just another bull trap or a beginning of a new bull market, as sellers might dominate again.
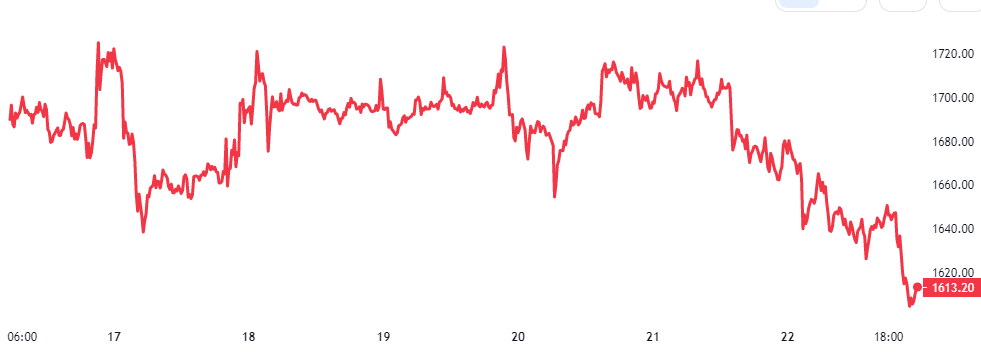
ETH Price
At the time of writing, Ethereum is trading around $1,600, up 4% in the last week.

You can get bonuses upto $100 FREE BONUS when you:
💰 Install these recommended apps:
💲 SocialGood - 100% Crypto Back on Everyday Shopping
💲 xPortal - The DeFi For The Next Billion
💲 CryptoTab Browser - Lightweight, fast, and ready to mine!
💰 Register on these recommended exchanges:
🟡 Binance🟡 Bitfinex🟡 Bitmart🟡 Bittrex🟡 Bitget
🟡 CoinEx🟡 Crypto.com🟡 Gate.io🟡 Huobi🟡 Kucoin.


Comments