In this week’s crypto highlights, we explore the price movements of BTC, KAVA, ADA, and SHIB. Additionally, this recap includes other notable industry news items that occurred over the last seven days. Without further ado, let’s dive into the latest market developments.
Noteworthy market events
USDC depegged after the Silicon Valley Bank collapse
On March 10, Silicon Valley Bank (SVB) was forced to shut down by U.S. regulators, and around $175 billion of customer deposits were seized by the Federal Deposit Insurance Corporation (FDIC). SVB’s collapse is considered the largest bank failure since the 2008 financial crisis, and appears to be the result of a bank run after SVB’s announcement and sales of $21 billion in securities to get needed liquidity.
Circle, issuer for the USDC stablecoin, announced it had $3.3 billion of its reserves stuck on SVB. This caused a panic sell-off of USDC, leading to its depeg, and a price drop to $0.87 in a day. The DAI and FRAX also lost their peg to the U.S. dollar following USDC, because the latter makes up a significant share of their collateral.
Circle stated that it will cover potential deficits using corporate funds and “external capital” to support USDC, if the company fails to return part of the stablecoin reserves held in SVB. Soon after that announcement, the U.S. Treasury, the Fed, and the FDIC released a joint statement about the launch of a program to support the banks, including SVB. After that, the USDC stablecoin started to return to $1.
Crypto-friendly Signature Bank was shut down due to “systemic risk”
In their joint statement, U.S. regulators communicated a ”similar systemic risk exception for Signature Bank,” which was closed by the state chartering authority in New York. Signature Bank was one of the major banks used by crypto companies.
For instance, Coinbase held $240 million in the bank, Paxos — $250 million, and the TrueUSD issuer, Techteryx, said it also held a “small amount” of funds with Signature. As of March 8, crypto-related client deposits were valued at $16.5 billion.
Despite the bank closure, Signature’s payments platform popular with institutional crypto clients, Signet, continues to operate, at the time of this writing. U.S. regulators assured depositors of Signature Bank that they will have full access to their funds this week. On the other hand, shareholders and “certain unsecured debtholders” will not be protected.
New York Attorney General alleges Ether is a security in KuCoin lawsuit
New York State Attorney General Letitia James filed a lawsuit against the KuCoin crypto exchange for failing to register as a securities broker-dealer, while still offering the sale of securities, including ETH. This suit is considered the first time a regulator has claimed in court that Ether is a security.
According to the lawsuit, the New York State Attorney General’s office argues that ETH is a speculative asset that “relies on the efforts of third-party developers in order to provide profit to the holders of ETH.” In addition, it claims that ETH “incentivizes users to stake ETH with the goal of making profits from those staked returns.”
Crypto Twitter opposed this statement. For instance, Coin Center, a non-profit organization focused on the policy issues facing cryptocurrencies, claimed ETH is not a security because the ETH token is different from the agreement to fund Ethereum as a project.
Euler Finance experienced a $197 million hack
Decentralized finance (DeFi) lending protocol Euler Finance suffered an exploit that resulted in almost $200 million being lost. According to smart contract auditor BlockSec, the losses occurred over four transactions in DAI, WBTC, sETH, and USDC. Eular Labs confirmed the exploit. At the moment of this writing, this event is considered the largest DeFi hack in 2023.
It is assumed that the attackers carried out six different flash-loan attacks. This happens when lenders offer smart contract loans without collateral, but they’re canceled if the borrower doesn’t quickly repay the loan within the same block. Scammers typically exploit flash loans by using those borrowed funds to buy huge amounts of crypto, and artificially raise its price before selling. They then repay the loans and keep the profits.
Euler Finance disabled the vulnerable EToken module, blocking deposits. The project team has already notified U.S. and U.K. law enforcement agencies about the hack. In addition, Euler Finance asked analytics firms Chainalysis and TRM Labs to help investigate the incident.
BTC may see another rally if it consolidates above a crucial level
Bitcoin price movement resembled a rollercoaster over the last seven days. At first, the asset dropped below $20,000 amid the SVB collapse. But then it moved above $24,000 after news about the program to support the U.S. banking system.
The next day, the consumer price index (CPI) data was released, showing the prices in February were 6% higher than a year ago, down from an annual rate of 6.4%. A decline in U.S. inflation fueled optimism in crypto markets, and Bitcoin approached $26,000. After that, the price slightly corrected below $25,000.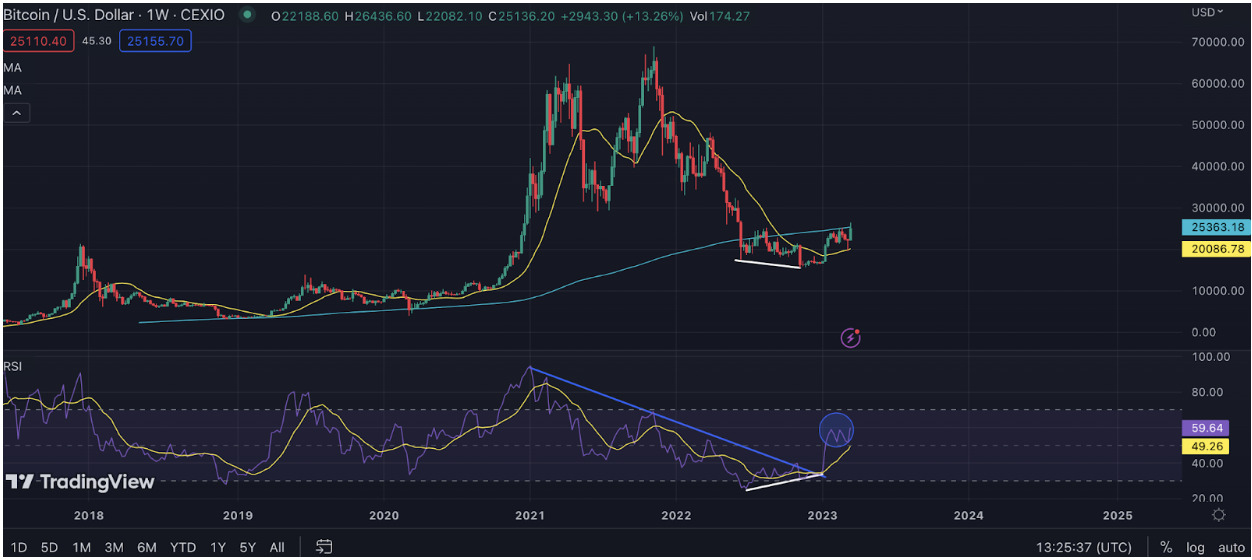
As we mentioned two months ago, Bitcoin could experience increased bullish pressure in the longer term. The asset formed a strong bullish divergence (white lines) and broke the descending RSI trendline (blue line) on a weekly chart. After the recent price movements, the weekly RSI moved to the positive zone (blue circle), meaning the path of least resistance is up.
In addition, Bitcoin bounced off the 20-week SMA (yellow line) and reached the 200-week SMA (cyan line). The first moving average typically acts as a dynamic support/resistance level on the weekly Bitcoin chart, while the second one acted as a major support level in previous cycles.
This means if the price breaks out above the 200-week SMA, it could be a bullish sign. At the moment of this writing, this moving average is located near $25,000.
&
The $25,000 level acts as a major resistance to the price. Looking at the Volume Profile Visible Range (VPVR) metric (blue-yellow one), you may notice that there is a little trading volume between $25,000 and $28,250 (purple rectangle). This means if the price consolidates above $25,000, it could reestablish bullish momentum.
VPVR is an indicator that determines the historical trading volume for the visible areas of the asset’s price. It could help define potential support/resistance levels. For this analysis, we applied VPVR over the last two years of accumulation.
Another bullish catalyst could be a recent daily RSI’s breakout of the descending line. The asset is far from the overbought zone, meaning it has the potential to continue its upward movement. However, if Bitcoin fails to consolidate above $25,000, it could lead to a price correction. The next potential price targets could be $23,000 and $21,500.
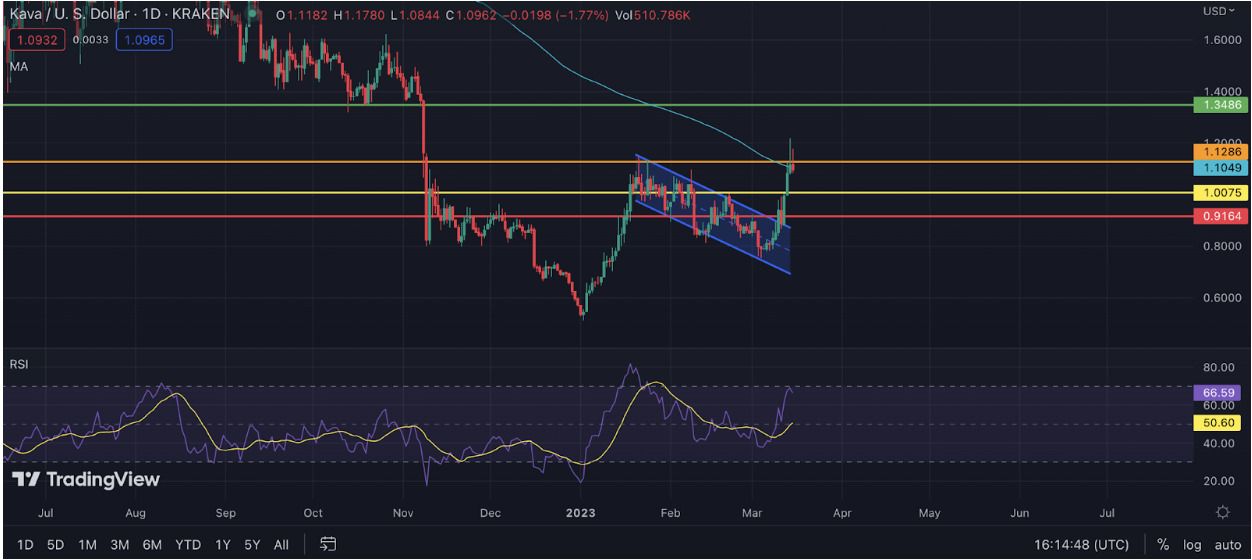
KAVA broke out from a descending channel
Over the last seven days, KAVA has become one of the biggest gainers among the top 100 cryptocurrencies. A potential catalyst behind this rally could be newly launched validator incentives.
The asset moved to the 200-day SMA, and is currently consolidating near the $1.12 resistance level. KAVA moved out of the overbought zone on daily and lower time frames, meaning there is room for a breakout above $1.12.
However, KAVA’s trading volume dropped by more than 50% after the previous attempt to sustain above 200-day SMA. This suggests that bullish momentum could fade away soon. In this case, the price correction could follow, with the next potential targets near $1 and $0.91.
ADA is near a make-or-break level
The ADA price bounced off the 0.618 Fibonacci level, which is typically considered the final target for the correction. But then, the asset rejected the crossover point of 50-day and 200-day SMAs, moving below $0.33.
This area is crucial since it previously provided support and coincided with the 0.5 Fibonacci level. Therefore, whether the price gets rejected from it, or reclaims it instead, could determine the future trend.
The daily RSI is trending downwards, indicating that the bearish momentum is not over. However, if the asset breaks the descending trendline (white line), this may reestablish bullish sentiment. 0.382 and 0.618 Fibonacci levels could act as the closest resistance and support levels, respectively.
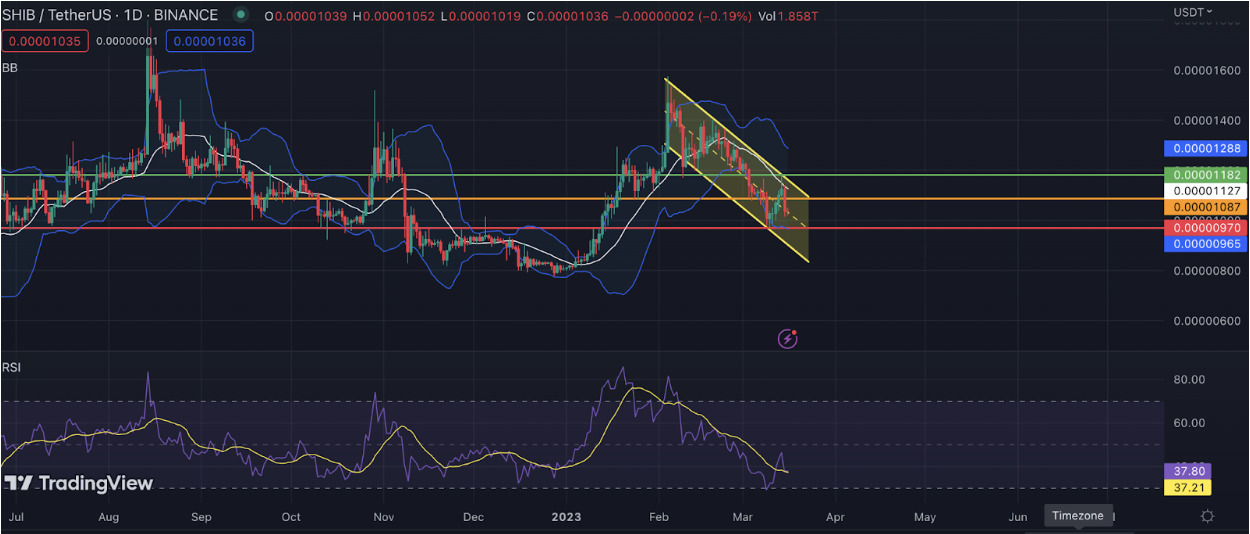
SHIB may continue moving inside a downtrend
On March 11, Shiba Inu developers launched an early public beta test of the Shibarium layer 2 protocol. However, it didn’t end well, because the community argued over the dubious origin of Shibarium.
The community members claim that Shibarium is a ripoff of the Rinia chain, pointing to the fact that even the chain ID was unchanged. Some also claim that the multi-sig wallet is not run by unique individuals.
These allegations and the community’s disappointment could tank the SHIB price even further. At the moment of this writing, the asset is moving inside a descending channel (yellow one). In addition, SHIB rejected the middle of the Bollinger channel (white line). It hints that the lower border of this channel could be the next target.
Tune in next week, and every week, for the latest CEX.IO crypto highlights. For more information, head over to the Exchange to check current prices, or stop by CEX.IO University to continue expanding your crypto knowledge.
&
&
Disclaimer: For information purposes only. Not investment or financial advice. Seek professional advice. Digital assets involve risk. Do your own research.

You can get bonuses upto $100 FREE BONUS when you:
💰 Install these recommended apps:
💲 SocialGood - 100% Crypto Back on Everyday Shopping
💲 xPortal - The DeFi For The Next Billion
💲 CryptoTab Browser - Lightweight, fast, and ready to mine!
💰 Register on these recommended exchanges:
🟡 Binance🟡 Bitfinex🟡 Bitmart🟡 Bittrex🟡 Bitget
🟡 CoinEx🟡 Crypto.com🟡 Gate.io🟡 Huobi🟡 Kucoin.










Comments