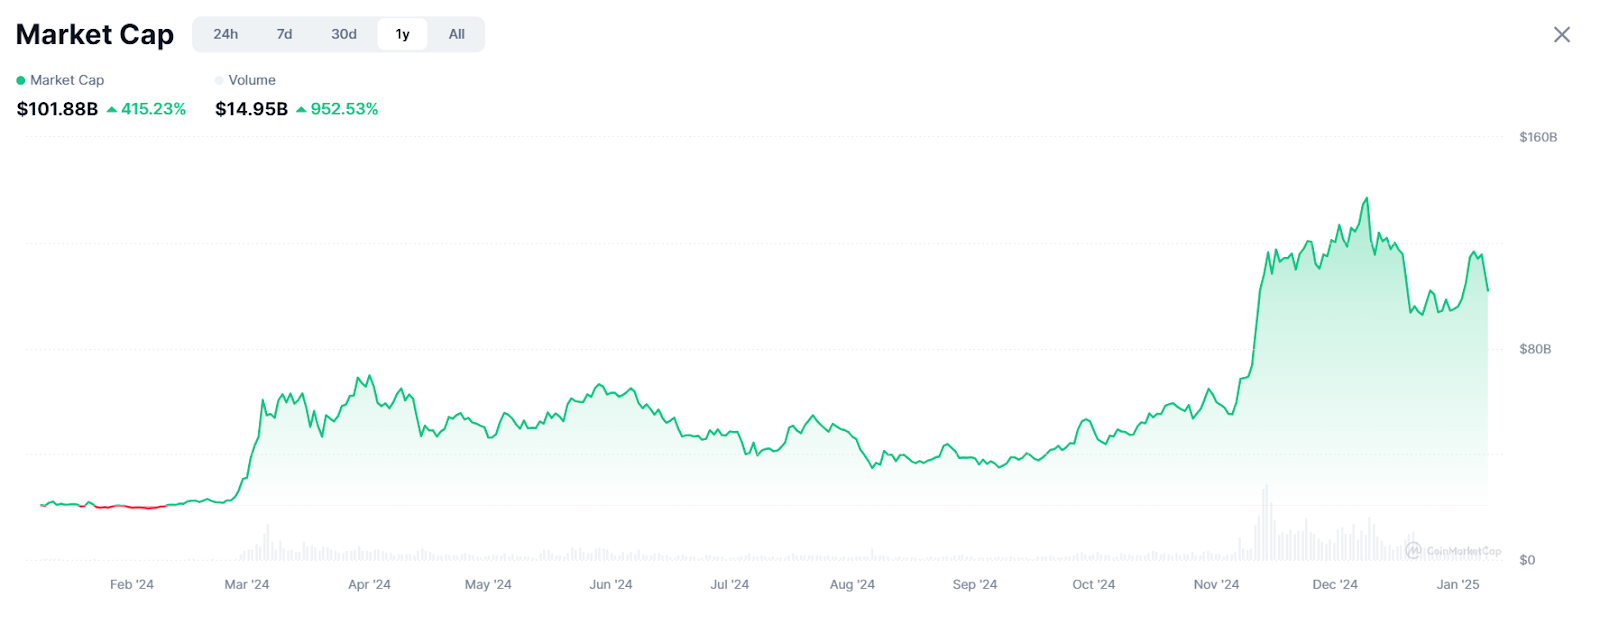
 | Intro One of the amazing parts of crypto is how much data we have that can inform our decisions. There are a lot of bottom indicators and many of these indicators have been shown to work rather well in the past. With the assumption that these indicators can offer some valuable information, what can we learn from them now? Importantly, we could debate whether or not these bottom indicators are useful or not, but that is not the goal of this post, so dont do that thanks. This is just an attempt of creating an overview of what the bottom indicators say right now. Hence, if your idea is to say something along the lines of: "I am going to post that technical analysis is useless and that the current macro economic environment means that technical analysis is out of the window and win those sweet, sweet moons!" then please stay away. (1) The rainbow chart - YES Let's start with the goofy one. The rainbowchart uses a simple logarithmic growth curve to forecast the potential future price direction of Bitcoin. Currently, it is at the lowest level of "Basically a Fire Sale" and about to dip below. The only time this happened in the past was during the COVID Crash and that was an amazing buying opportunity. The fire sale level has always been a great opportunity too. So based on past experiences, there is a good chance the bottom is in. A critical caveat is that the top did not reach the red upper band this time, which is a sign of worry. The "rainbow" might be misaligned and need finetuning. 2. Bitcoin 200 weekly moving average - MAYBE? The Bitcoin 200 weekly moving average is a moving average over, well, the past 200 weeks. It has been an amazing level of support and a clear bear market bottom indicator. We never spent long under this moving average. However, we have gone under it in June and failed to reclaim it, rejection off it even. So that is not a good look. Based on this indicator, one would expect this to be a good moment to buy, but the rejection is worrisome. 3. Total market cap 200 weekly moving average - YES This is actually my favorite chart, because it is is often more predictive than looking at just Bitcoin. And given how big alts have become (more than 60% market cap), this makes sense. The downside is that this also has stablecoins in there, I believe. Again, we always held this 200 weekly MA level, and we are actually currently holding it still, retesting it for the second time. I would be worried if we dip below this one over a longer period, though. So far so good. Total market cap 200 weekly moving average 4. Pi cycle indicator - YES The Pi cycle indicator forecasts tops and bottoms for Bitcoin. It is based on two long-term moving averages: 471-day simple moving average and 150-day exponential moving average. The signal lights up when the latter falls below the former. Historically, it has been very effective in picking out cycle lows as you can see on the (blurry) chart, doing so successfully in 2015 and 2018. It flashed again this summer, suggesting the low is already in. 5. Hash ribbons indicator - YES The Bitcoin Hash Ribbon indicator tries to identify periods where Bitcoin miners are in distress and may be capitulating. The assumption is that such periods can occur when the price of $BTC is at major lows, and may therefore present a good opportunity to buy the dip. Two weeks ago, the bitcoin miner capitulation officially ended after 71 days. This capitulation zone was longer than 2021, and two days shorter than 2018's capitulation at $3.1k. 6. Puell Multiple indicator - YES The Puell Multiple is calculated by dividing the daily issuance value of bitcoins (in USD) by the 365-day moving average of daily issuance value. This is rather technical, but importantly, the Puell Multiple uses the upper red band on the chart to show when miner revenues in USD terms are significantly higher than historical norms (in this case the 365-day moving average). So the Puell Multiple can be a useful Bitcoin forecasting tool to identify based on this metric whether price is too high and needs to drop (when the indicator is in the red zone), or whether it is too low and may need to bounce (indicator is in the green zone). Almost every time the red line reaches the green zone and leaves again, the bottom was in and we are due for a significant bounce. 7. MRV Z-score indicator - NO OR MAYBE? MVRV Z-Score is a bitcoin chart that uses blockchain analysis to identify periods where Bitcoin is extremely over or undervalued relative to its 'fair value'. It uses the market value (blue line), realised value (orange line) and z-score (red line). Specifically, The MVRV Z-score is a function of the difference between total market cap and realized market cap, divided by the standard deviation of the market cap. This shows by how many standards deviations the market value differs from the realized value. It evaluates if Bitcoin is over or under-evaluated compared to its "normal" value. Again, the green parts are always amazing buy opportunities but the price could still go down a bit from here based on previous data. We have not touched the lower band yet. 8. 85% drawdown from all time high - NO A key aspect of every bear market so far is that we go down at least 85% from the all time high. In 2015, we dropped about 87% and in 2018 we dropped about 85%. Currently, we are down about 75%. Based on this indicator, we have some way to go, and this is why many people expect $10k. That said, we also did not rise as much from the bottom as in previous cycles, so it is unclear whether the drop should be as steep as before. Note, however, that everytime before during the bear when we dropped 70-70%, a 100% rally happened before further drawdown. So even based on previous bears, we should expect a bounce. 9. Weekly RSI - YES The relative strength index (RSI) is a momentum indicator used in technical analysis. RSI measures the speed and magnitude of a security's recent price changes to evaluate overvalued or undervalued conditions in the price of that security. Based on the weekly RSI, we are at very undervalued conditions. Weekly RSI was even the lowest it has ever been, and this is also true for the monthly RSI. Everytime we hit the oversold values (under the purple highlighted area), bitcoin bottomed. We just went there again. Conclusion All-in-all, the 9 indicators do not agree on whether the bottom is in or whether more pain might follow, but definitely suggest that this is an awesome level to buy, for what that is worth, because the macro economy is terrifying and this might be the first recession crypto experiences. That bottom indicators are flashing should not be a surprise to anyone given how hard and fast we dropped. Personally, this is where I am DCAing as these are the prices I had hoped for a long time ago. I might be wrong and that is when I will buy more. I likely missed some bottom indicators though. What else is out there and what do these indicators say? [link] [comments] |

You can get bonuses upto $100 FREE BONUS when you:
💰 Install these recommended apps:
💲 SocialGood - 100% Crypto Back on Everyday Shopping
💲 xPortal - The DeFi For The Next Billion
💲 CryptoTab Browser - Lightweight, fast, and ready to mine!
💰 Register on these recommended exchanges:
🟡 Binance🟡 Bitfinex🟡 Bitmart🟡 Bittrex🟡 Bitget
🟡 CoinEx🟡 Crypto.com🟡 Gate.io🟡 Huobi🟡 Kucoin.


Comments