Cardano has observed some rise since hitting a low around the $0.23 level following the FTX collapse. However, here’s what on-chain data say about whether that was the bottom or not.
Three Cardano Indicators Shot Up During Local Bottom Formation
According to data from the on-chain analytics firm Santiment, three ADA metrics had surged to the highest level for 2023 when the price hit the $0.23 low. The first of these metrics is the “trading volume,” which measures the total amount of Cardano that’s being moved around on the blockchain every day by the users.
When the value of this metric goes up, it means that a large number of tokens of the asset are being transacted on the network right now. Such a trend can be a sign that traders are active in the sector currently.
On the other hand, low values of the metric imply the market is displaying low activity at the moment. This kind of trend may suggest that there is a lack of interest in the coin among the general investor.
The second indicator of interest here is the “daily active addresses,” which measures the daily total number of unique Cardano addresses that are taking part in some transaction activity on the blockchain.
This metric also provides us with hints about how active the market is, but the key difference between the daily active addresses and the trading volume is that the former contains information about the number of users visiting the network, while the latter does not.
A few whales making large moves will show up as an active market under the trading volume, while the active addresses would disagree as there aren’t many users involved in such a scenario. Naturally, both these indicators together can provide an accurate picture of the market.
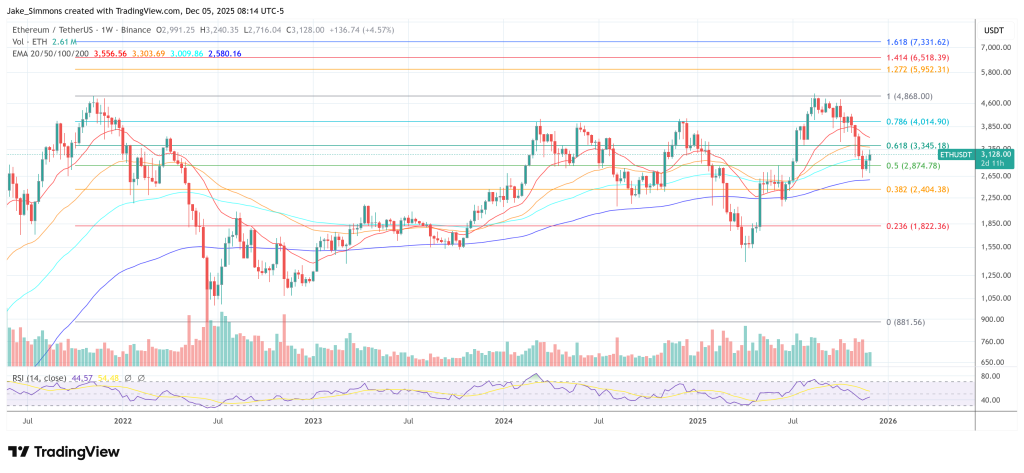
Now, here is a chart that shows the trend in these Cardano indicators over the last few months:
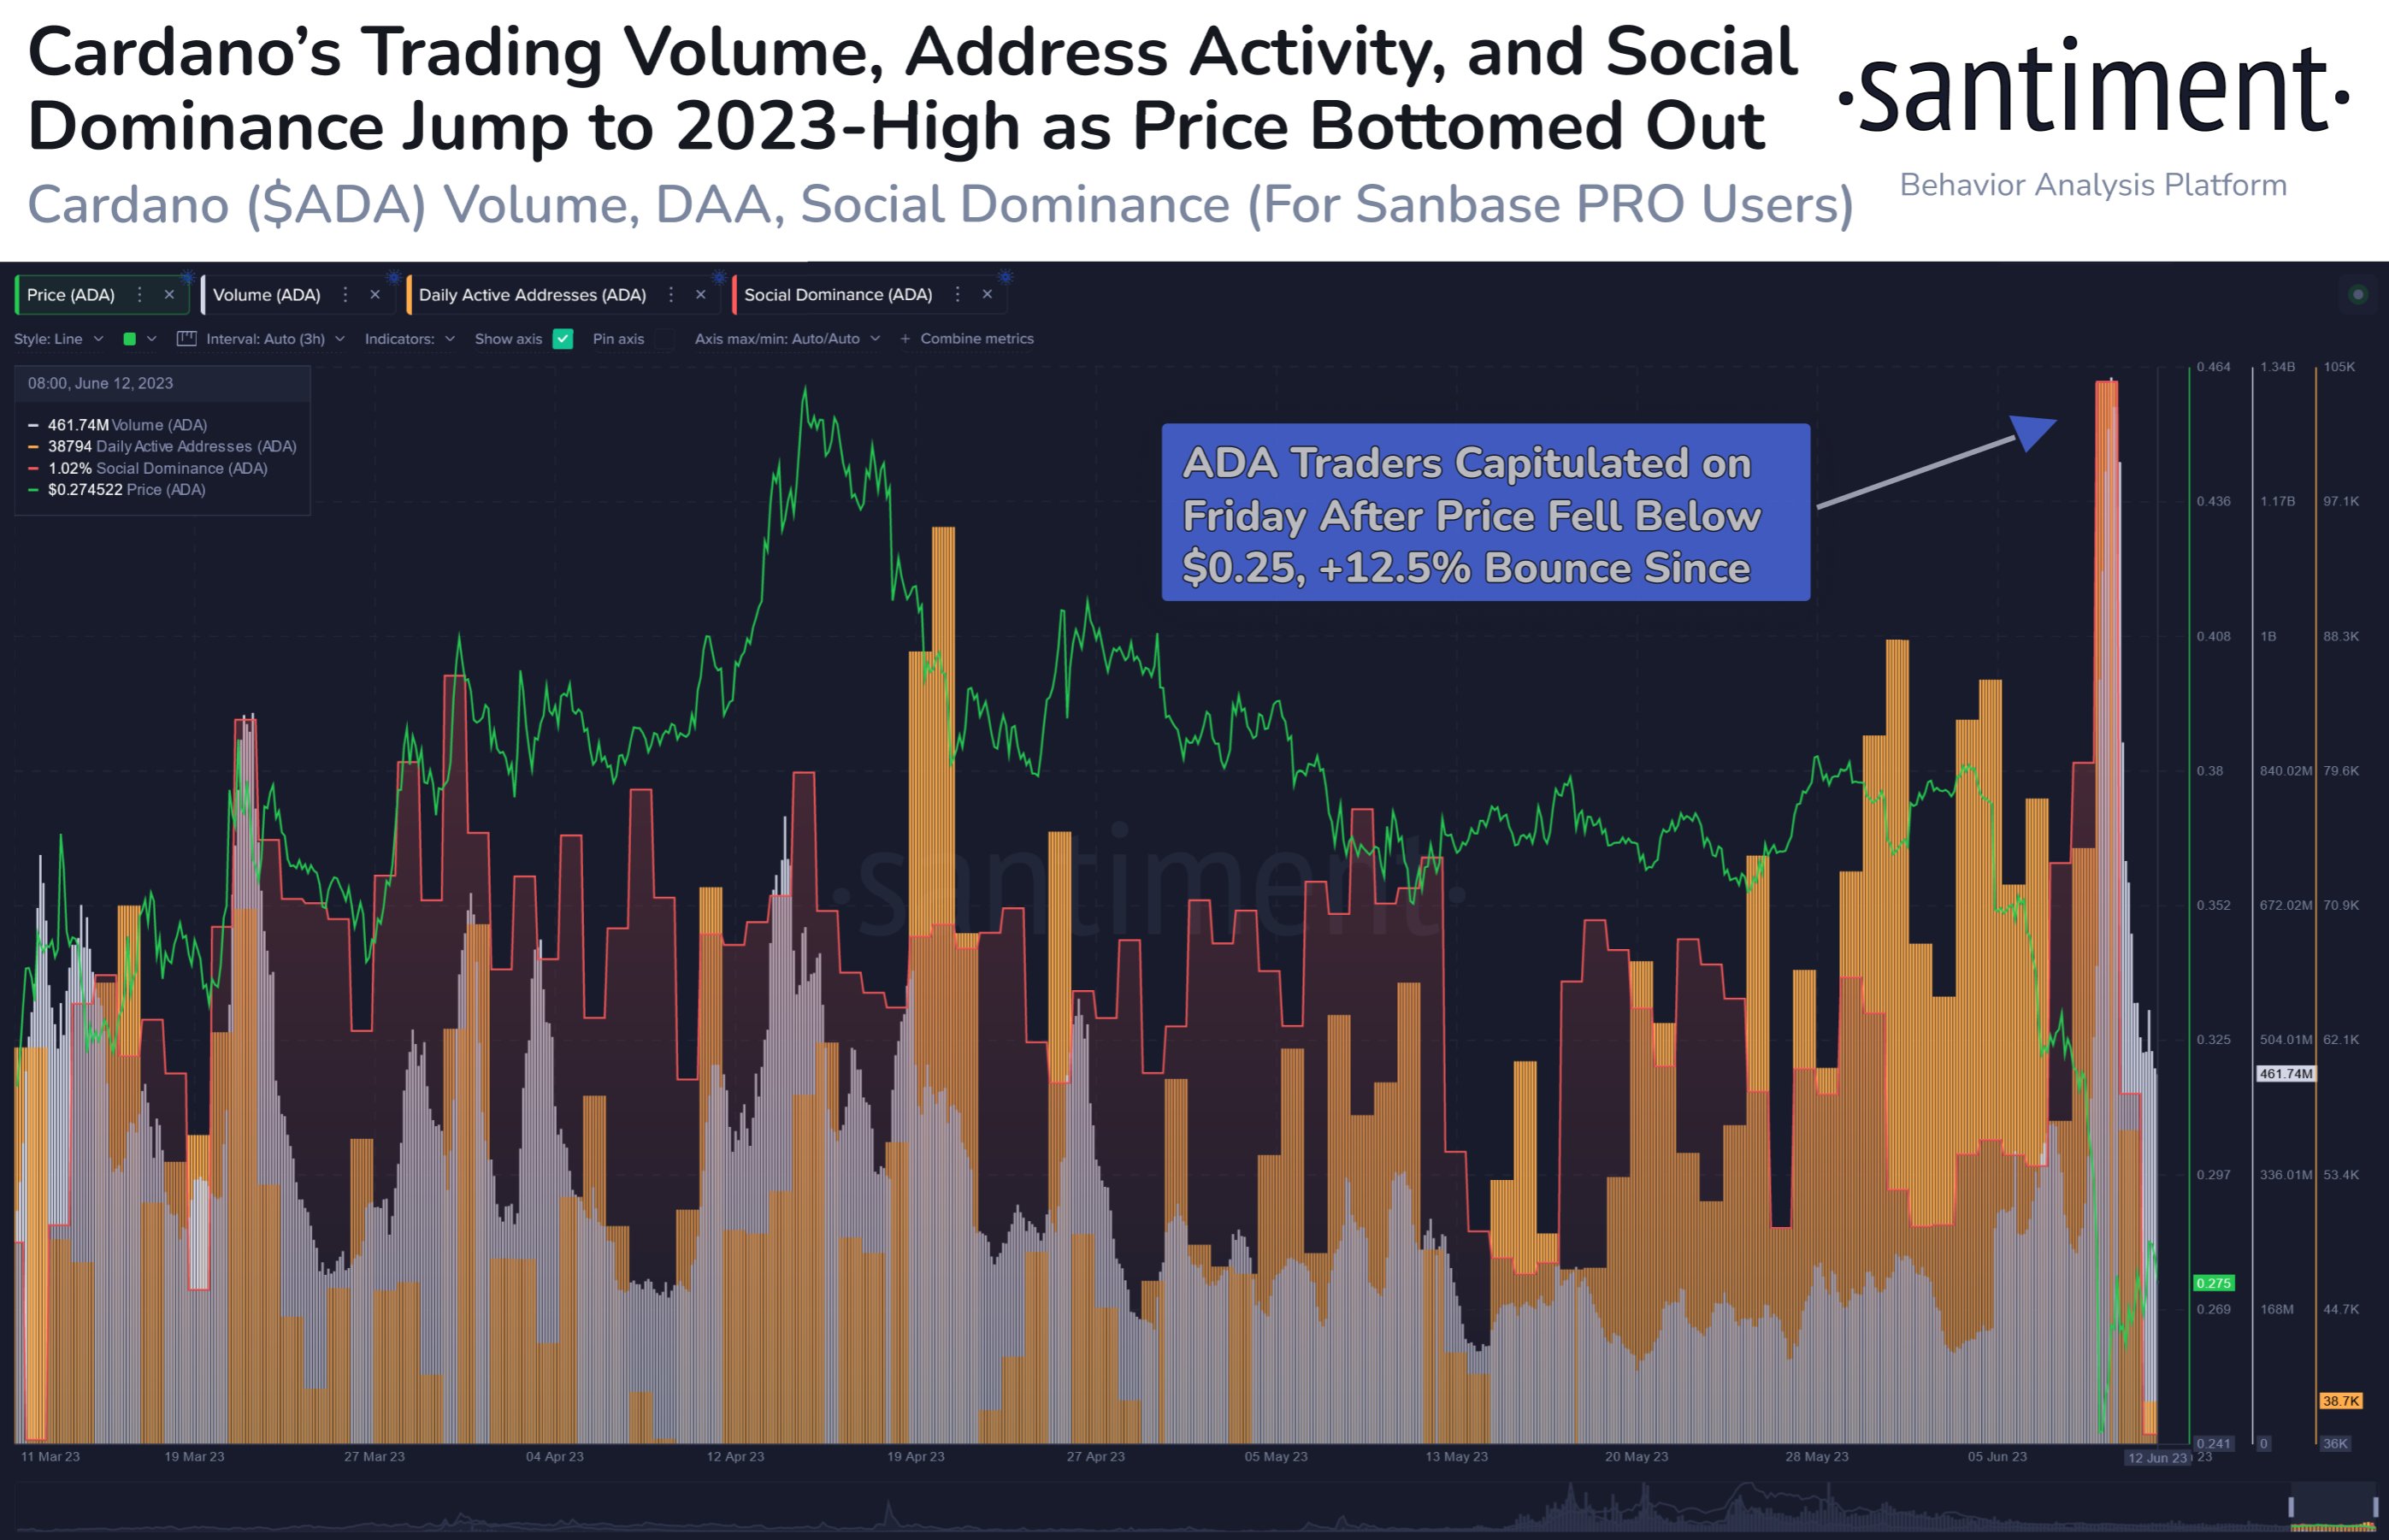
From the graph, it’s visible that both the trading volume and the daily active addresses spiked when the asset’s price was declining and hit a low around the $0.23 level.
This would imply that both in terms of the total number of users and the total amounts that they were shifting, the market had turned quite active during this price plunge.
The chart also includes the data for the third relevant metric here, “social dominance.” In short, this indicator tells us what percentage of discussions on social media related to the top 100 cryptocurrencies by market cap is coming from posts specifically about Cardano.
The ADA social dominance also shot up at the same time as the other indicators, implying that the interest around the asset jumped on social media as the price rapidly declined.
All these metrics rising together during the formation of this low might signal that there was genuine interest in buying the dip across the market. Naturally, if this is truly the case, the bottom may potentially now be in for Cardano.
ADA Price
At the time of writing, Cardano is trading around $0.27, down 22% in the last week.

You can get bonuses upto $100 FREE BONUS when you:
💰 Install these recommended apps:
💲 SocialGood - 100% Crypto Back on Everyday Shopping
💲 xPortal - The DeFi For The Next Billion
💲 CryptoTab Browser - Lightweight, fast, and ready to mine!
💰 Register on these recommended exchanges:
🟡 Binance🟡 Bitfinex🟡 Bitmart🟡 Bittrex🟡 Bitget
🟡 CoinEx🟡 Crypto.com🟡 Gate.io🟡 Huobi🟡 Kucoin.


Comments