The total crypto market capitalization (TOTAL on TradingView) chart is showing signs that volatility could dramatically expand after dropping to historic lows. This tightening of volatility often precedes massive breakouts. Could this cause the crypto market to go supernova?
Total Crypto Market Reaches Tightest Monthly Bollinger Bands Ever
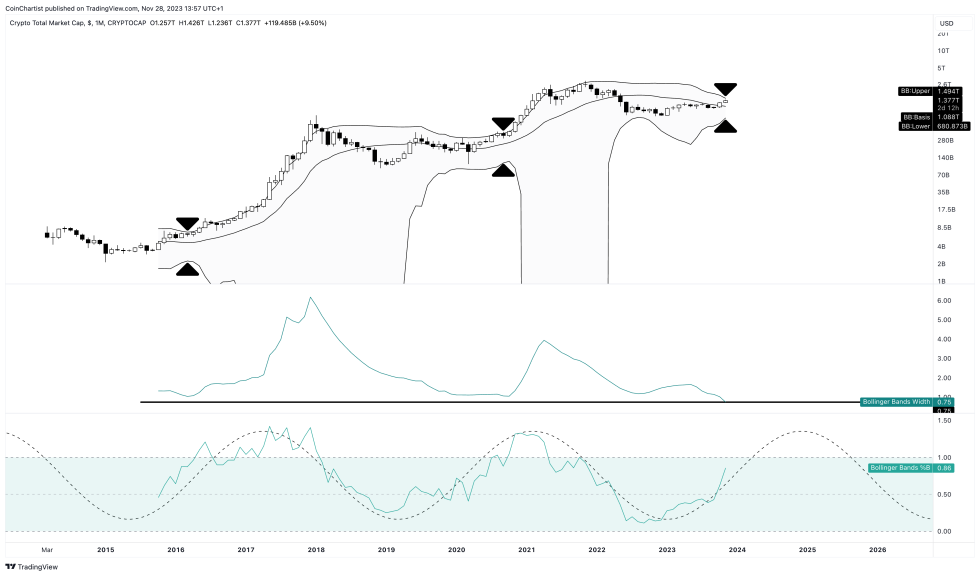
The total crypto market cap volatility on the 1-month timeframe has sunk to its lowest levels ever based on the Bollinger Band Width indicator. The tighter the Bollinger Bands squeeze, generally the more explosive the eventual expansion.
Essentially, this is the tightest the monthly Bollinger Bands have ever contracted in crypto history. According to the principles behind these volatility bands, when they narrow to extreme levels it typically leads to a powerful move as pent-up energy releases.
While volatility is direction-neutral, other factors point to the chance this could emerge as an upward breakout. For example, the %B indicator showing the price in relation to the Bollinger Band basis is holding above 0.50, which is generally supportive of bullish momentum.
More broadly, volatility tends to be cyclical across financial markets. Periods of low volatility lead into high volatility regimes and back again. By using the tight Bollinger Bands to measure compressed volatility, traders can predict when crypto markets are poised to enter an explosive high volatility cycle again.
Crypto Big Bang: Why Low Volatility Could Release An Explosive Move
Unlike previous crypto rallies that centered on Bitcoin, this imminent volatility expansion would involve the total crypto market cap instead of any single asset. That means a potential rising tide for altcoins unlike the massive Bitcoin dominance seen in past several months.
One key point is that statistically price moves outside the -2 and +2 standard deviation Bollinger Bands less than 5% of the time. When prices do exceed these bands, it typically signals powerful trends brewing.
The historically tight squeeze suggests the crypto market cap is absorbing energy to fuel a breakout. Whether that emerges as a bull or bear move is unclear, but the sheer velocity could resemble a supernova explosion judging by these technicals.
For traders and investors, preparing for expanding volatility allows capitalizing regardless of the direction it breaks. But the likelihood is high that a historic move lurks beneath the surface of recent calm in the crypto sphere.
This chart originally appeared in the latest issue of CoinChartist VIP. Check out the rest of the issue here.

You can get bonuses upto $100 FREE BONUS when you:
💰 Install these recommended apps:
💲 SocialGood - 100% Crypto Back on Everyday Shopping
💲 xPortal - The DeFi For The Next Billion
💲 CryptoTab Browser - Lightweight, fast, and ready to mine!
💰 Register on these recommended exchanges:
🟡 Binance🟡 Bitfinex🟡 Bitmart🟡 Bittrex🟡 Bitget
🟡 CoinEx🟡 Crypto.com🟡 Gate.io🟡 Huobi🟡 Kucoin.


Comments