- Kusama (KSM) looks bullish on a lower timeframe.
- Kusama (KSM) price eyes a reclaim of 50 Exponential Moving Average (EMA) on the daily timeframe.
- Kusama (KSM) price aims to break above 50 EMA in the 4H timeframe.
Kusama (KSM) has had a tough time recently but has shown great strength bouncing up in higher and lower timeframe. Kusama (KSM) price has struggled to remain bullish as the price fell from an all-time high of $600 to $38, with the price maintaining a downtrend with little hope of a relief rally or bounce against tether (USDT). (Data from Binance)
Kusama (KSM) Price Analysis On The Daily ChartDespite a decline in its price from $600 to $38, over 70% decline from its all-time high, the price of KSM has shown great strength as it bounced from its daily low of $38 to a high of $43 as price eyes a major resistance at around $50. The price of KSM needs to break and hold above this resistance for the price to trend higher.
The price of KSM on the daily chart looks strong despite seeing some volatility across the crypto market, with eyes set on breaking the daily resistance of $50. KSM price needs to break and hold above this region to assume more bullish sentiment; if the price gets rejected, we could expect the price of KSM to retest $45-$40.
REEF’s price is trading at 0.0048$ below its resistance; the price of REEF needs to hold above $0.007 to avoid the price from going lower due to the sell-off. If the REEF price holds this region, there could be more belief of a rally to its resistance at $0.007 and possibly breaking and holding above this region.
Daily resistance for the price of KSM- $50.
Daily support for the price of KSM – $38.
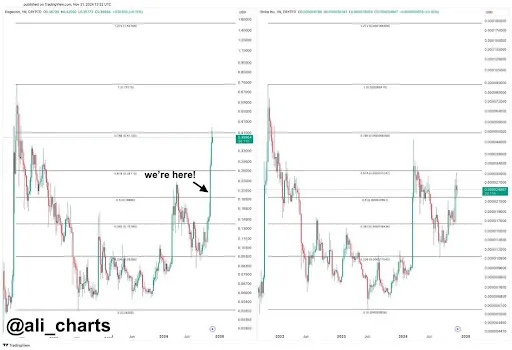
Price Analysis Of KSM On The Four-Hourly (4H) Chart Four-Hourly KSM Price Chart | Source: KSMUSDT On Tradingview.comThe 4H timeframe shows the price of KSM, after touching a low of $38 price bounced to a region of $43, where it attempts to break above the 50 Exponential Moving Average (EMA).
On the 4H timeframe, the price of KSM is currently trading at $43, just below the 50 Exponential Moving Average (EMA), trying to break and hold above this region, acting as resistance for the KSM price. The price of $43 corresponds to the resistance at 50 EMA.
If the price of KSM fails to reclaim this major area, we expect the price to retest the region of $40 for more demand to push the price to a higher height.
The Relative Strength Index (RSI) for KSM is above 50 on the four-hourly chart, indicating decent buy order volume.
Daily resistance for the KSM price – $45.
Daily support for the KSM price – $38.
Featured Image From Capital, Charts From Tradingview
You can get bonuses upto $100 FREE BONUS when you:
💰 Install these recommended apps:
💲 SocialGood - 100% Crypto Back on Everyday Shopping
💲 xPortal - The DeFi For The Next Billion
💲 CryptoTab Browser - Lightweight, fast, and ready to mine!
💰 Register on these recommended exchanges:
🟡 Binance🟡 Bitfinex🟡 Bitmart🟡 Bittrex🟡 Bitget
🟡 CoinEx🟡 Crypto.com🟡 Gate.io🟡 Huobi🟡 Kucoin.


Comments