Polkadot price has registered a bullish revival on their 24-hour chart. Over the past day, DOT logged double-digit gains. In the past week, the altcoin has lost close to 3% of its market value.
The major market movers have turned optimistic today, and most altcoins have followed suit.
The technical indicator of Polkadot has registered bullish signals on the one-day chart.
The demand for the altcoin has increased, which has made the coin register more buyers on the chart.
The coin has to continue cruising up to move past the immediate resistance level.
The move past the immediate resistance mark will ensure that the bulls have complete control over the market. Breaking past the $6.87 will confirm the bullish revival further.
The coin can still fall in value if the buying strength starts to fade over the next trading sessions. The global cryptocurrency market cap today is $979 billion, with a 1.1% positive change in the last 24 hours.
Polkadot Price Analysis: One-Day Chart
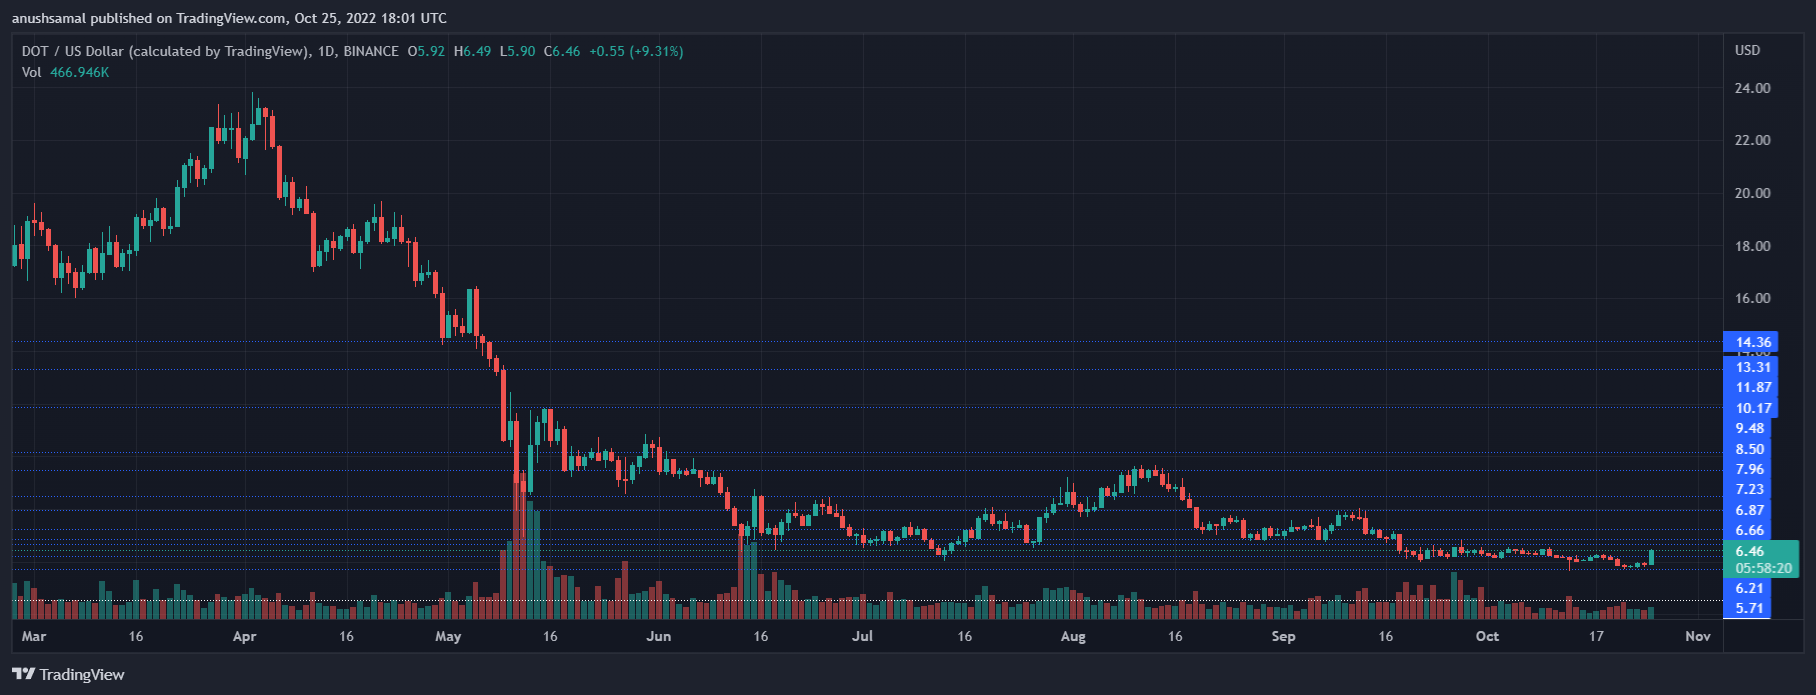
DOT was trading at $6.40 at the time of writing. The coin has been consolidating for almost two months now. It finally managed to secure some gains over the last 24 hours.
Immediate resistance for the coin stood at $6.80 and the other tough resistance point was at $7.20. A move above the $7.20 mark will help the coin revisit the $8 price level too.
The support line for Polkadot price stood at $6.21. A slight loss in the market price will push the price of the altcoin to that level.
Falling from the $6.21 mark could bring the Polkadot price to $5.71. The amount of Polkadot traded in the last trading session increased, which meant that buyers returned to the market.
Technical Analysis
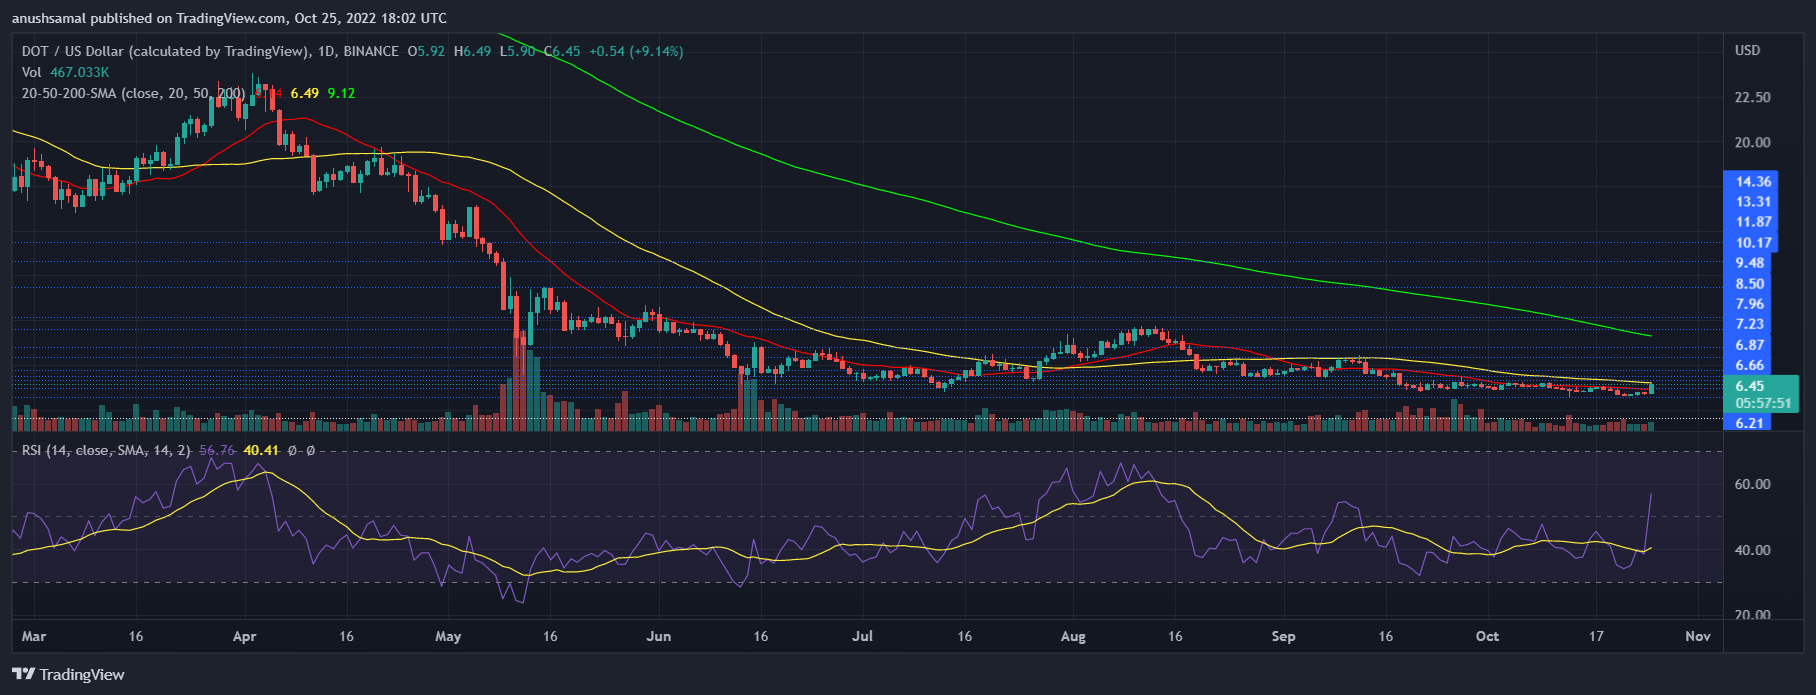
For most of this month, Polkadot has consistently been in control of the sellers. Technical indicators finally point towards the buyers’ being in control of the market.
The Relative Strength Index shot past the half-line as a sign of steep recovery. This indicated that sellers were fewer in numbers as compared to buyers.
Polkadot price was above the 20-SMA line, and that signified increased demand. It also meant that buyers were driving the price momentum in the market.
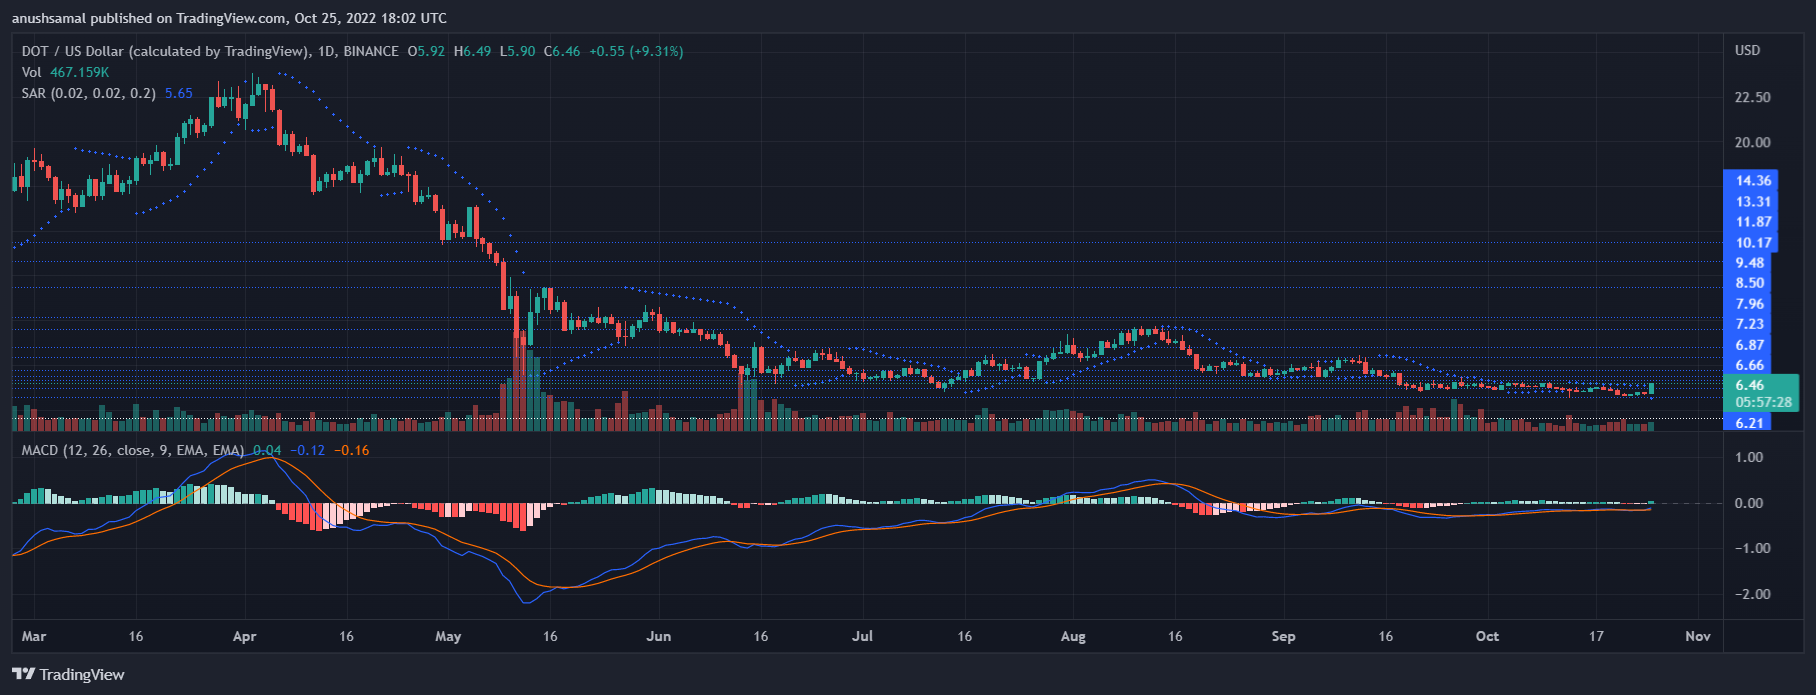
The other technical indicators have also displayed that the demand brought back buyers into the market. The Moving Average Convergence Divergence indicates the overall price action and the price momentum of the altcoin.
MACD underwent a bullish crossover and displayed green histograms which were the buy signal. Parabolic SAR also determines the price direction of the altcoin.
The dotted lines were visible below the price candlestick which was an indication that the coin was bullish on the one-day chart.
Featured Image From TechStory, Charts From TradingView
You can get bonuses upto $100 FREE BONUS when you:
💰 Install these recommended apps:
💲 SocialGood - 100% Crypto Back on Everyday Shopping
💲 xPortal - The DeFi For The Next Billion
💲 CryptoTab Browser - Lightweight, fast, and ready to mine!
💰 Register on these recommended exchanges:
🟡 Binance🟡 Bitfinex🟡 Bitmart🟡 Bittrex🟡 Bitget
🟡 CoinEx🟡 Crypto.com🟡 Gate.io🟡 Huobi🟡 Kucoin.


Comments