On-chain data shows the Polygon network growth has been rising while the price has consolidated, a divergence that may be bullish for the price.
Polygon Network Growth Has Been Trending Up Recently
As pointed out by an analyst on Twitter, a bearish divergence in the indicator also formed a while ago that ended up taking the price down 40%. The “network growth” is an indicator from the on-chain analytics firm Santiment that measures the total number of new Polygon addresses.
The indicator works by looking at the blockchain data to see which addresses are making their first-ever MATIC transactions. Such addresses are considered “new” and the metric adds them to its value.
When the value of this metric is high, it means a large number of new addresses are becoming active on the network right now. Generally, new addresses are assumed to be coming from new users joining the network, and hence, a high value of this metric can be a sign of rapid adoption of the cryptocurrency.
On the other hand, low values of the indicator imply the blockchain isn’t observing many new users coming in currently. This kind of trend can suggest the adoption of the asset may be losing traction.
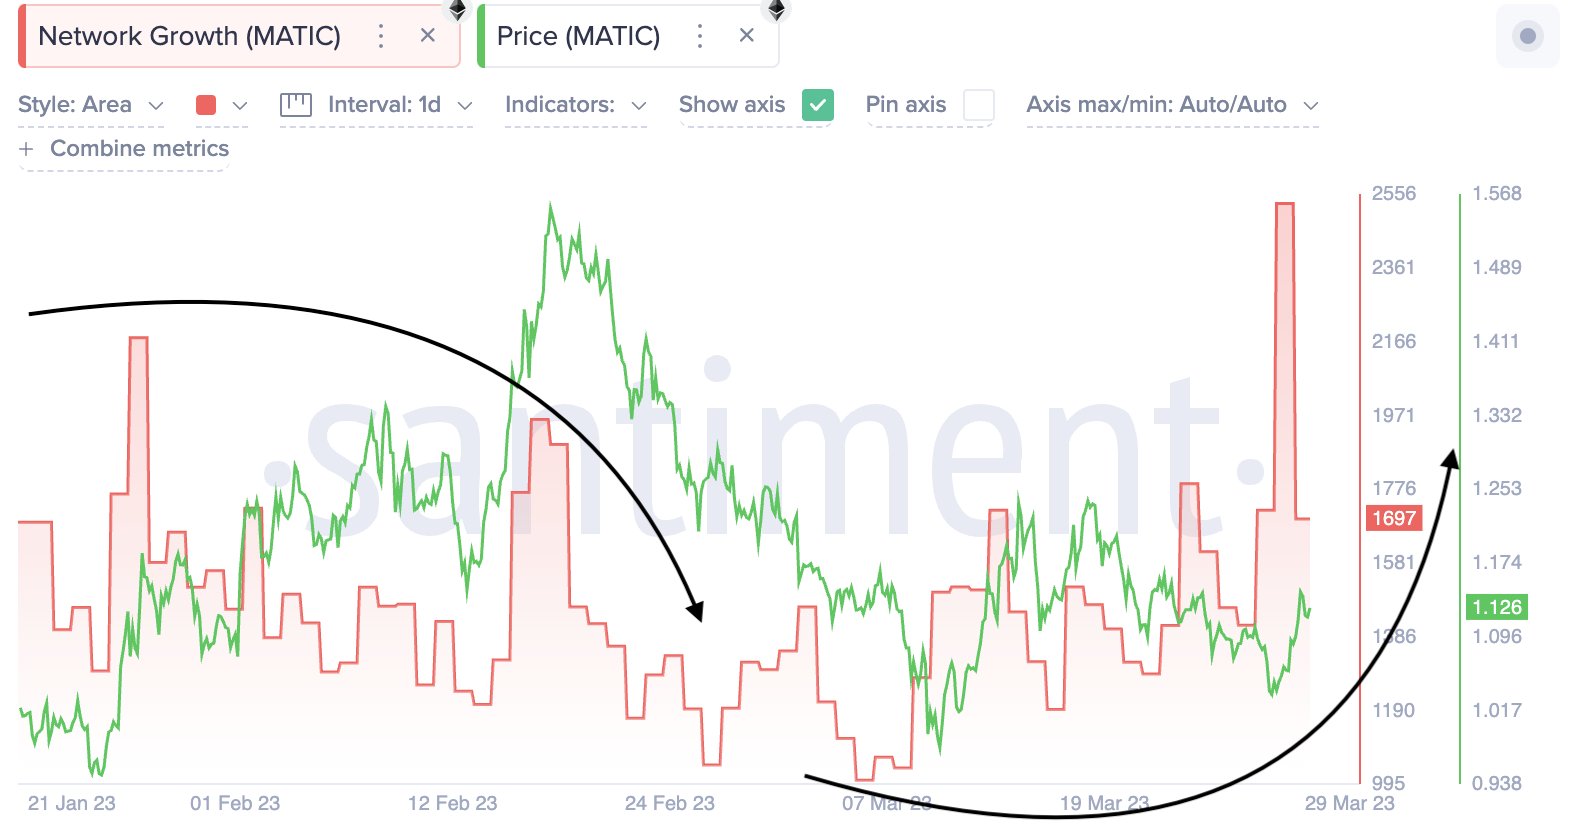
Now, here is a chart that shows the trend in the Polygon network growth over the last few months:
As shown in the above graph, the Polygon network growth had been on an overall downtrend earlier in the year. This means that the total number of new users joining the network every day was constantly going down. While this was happening, however, the price of the cryptocurrency was rapidly moving up.
A decent growth in the user base is ideal for the fundamentals of any network and can be bullish for the asset’s value in the long term. But as the price move earlier in the year accompanied a declining growth in new users, the rally was perhaps not sustainable.
After this negative divergence between the indicator and the value of Polygon formed, the asset saw a sharp drawdown of about 40% in its price and hit some relatively low levels.
Since this drop, the price has been mostly moving sideways. The MATIC network growth, however, has shifted towards observing a constant upwards momentum.
This uptrend in the metric implies the user base is growing at a rapid pace at the moment. As already mentioned earlier, adoption like this can be constructive for the network in the long term as it provides a solid base for sustainable growth.
Since the price and the indicator have once again diverged recently, the asset could again see some impact from this. But since the divergence is a bullish one this time, the analyst thinks that it may result in an upswing for Polygon.
MATIC Price
At the time of writing, Polygon is trading around $1.1, down 1% in the last week.

You can get bonuses upto $100 FREE BONUS when you:
💰 Install these recommended apps:
💲 SocialGood - 100% Crypto Back on Everyday Shopping
💲 xPortal - The DeFi For The Next Billion
💲 CryptoTab Browser - Lightweight, fast, and ready to mine!
💰 Register on these recommended exchanges:
🟡 Binance🟡 Bitfinex🟡 Bitmart🟡 Bittrex🟡 Bitget
🟡 CoinEx🟡 Crypto.com🟡 Gate.io🟡 Huobi🟡 Kucoin.


Comments