
Credit Suisse has pulled the U.S. equities markets lower, but a positive sign is that Bitcoin and select altcoins are holding near their local highs.
The United States equities markets tumbled on March 15 after Saudi National Bank, Swiss bank Credit Suisse’s largest investor, said it would not be able to provide any more funding to Credit Suisse due to regulatory limitations.
Investors are nervous because Credit Suisse, which has large U.S. and global operations, warned on March 14 that it had found “certain material weaknesses” in its financial reporting processes for 2021 and 2022. Shares of Credit Suisse plummeted to an all-time low on March 15.
After the events of the past few days, the S&P 500 has given back all its gains for the year and is trading flat. In comparison, Bitcoin (BTC) is holding on to a large part of its gains and is up nearly 47% in 2023.
Trezor Bitcoin analyst Josef Tětek believes the banking crisis could be positive for Bitcoin, as it could emerge as a safe-haven asset.

Capriole founder and CEO Charles Edwards said that Bitcoin has formed a “bump and run reversal pattern,” which has a target objective of $100,000 and higher. However, Edwards cautioned traders that the pattern could fail, hence it should not be used for building a trading or investment plan.
Could Bitcoin and altcoins rise above their overhead resistance levels and start the next leg of the up-move? Let’s study the charts of the top 10 cryptocurrencies to find out.
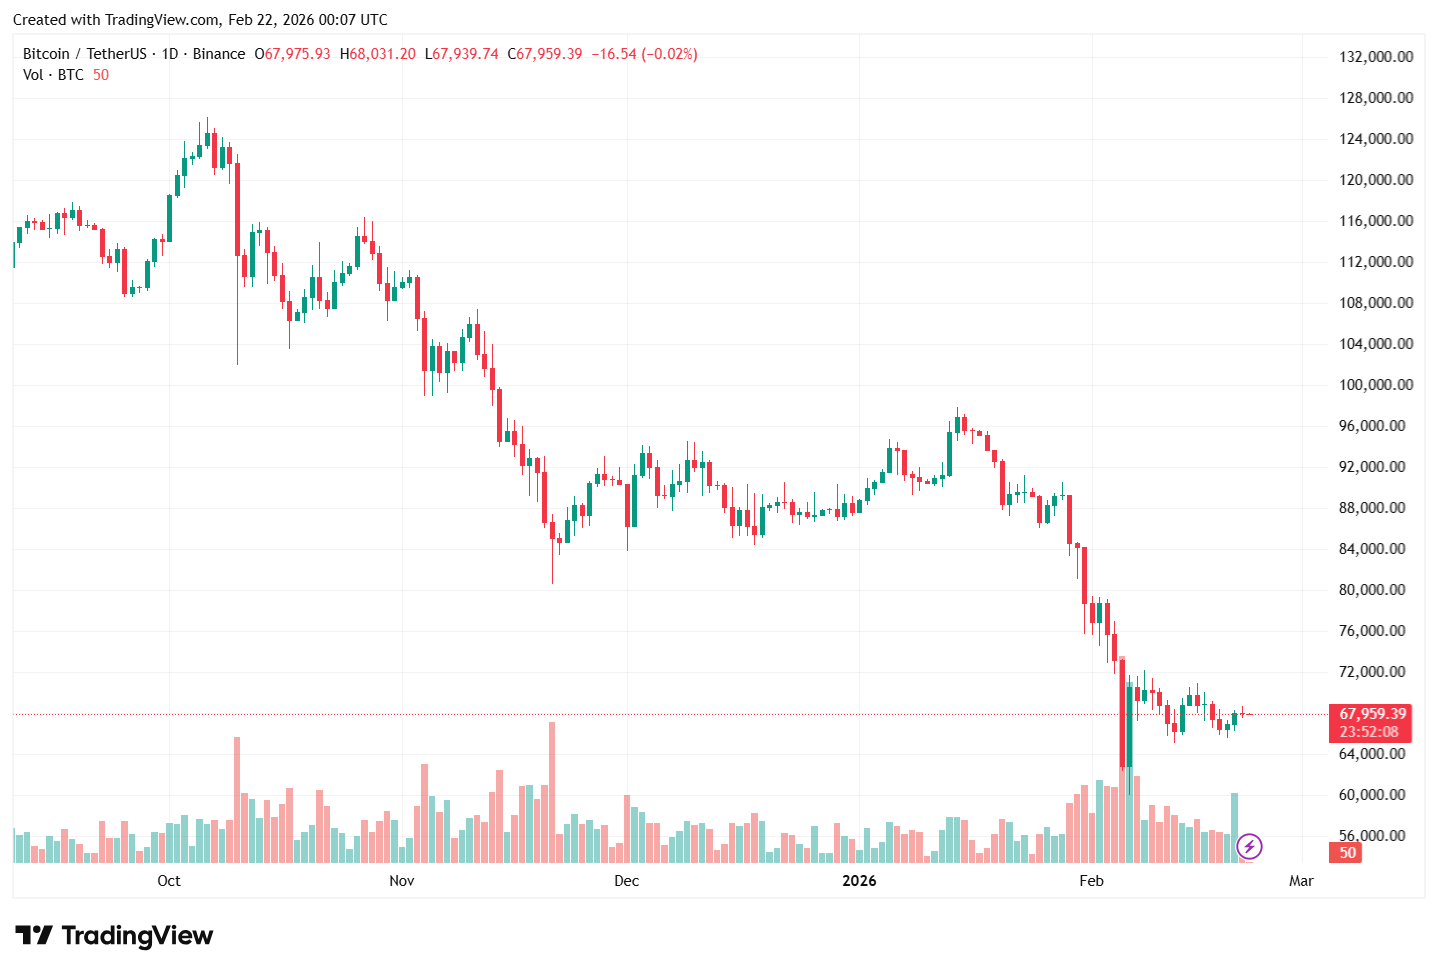
Bitcoin price analysis
The bulls propelled Bitcoin (BTC) above the overhead resistance of $25,250 on March 14 but the long wick on the candlestick shows that bears are not ready to surrender without a fight. Strong selling pulled the price back below $25,250.

The 20-day exponential moving average, or EMA ($23,012), has started to turn up, and the relative strength index (RSI) is in the positive territory, indicating an advantage to buyers.
If the bulls do not give up much ground from the current level, the possibility of a break and close above $25,250 increases. If that happens, the BTC/USDT pair will complete a bullish inverse head-and-shoulders (H&S) pattern. That will signal a potential trend change. The pair may then sprint toward $32,000.
If bears want to slow down the bullish momentum, they will have to quickly pull the price back below the moving averages.
Ether price analysis
Ether (ETH) soared above the overhead resistance at $1,743 on March 14, but the bulls could not sustain the higher levels. This suggests that the bears are trying to protect the level.

If the price consolidates between $1,743 and the 20-day EMA ($1,588), it will suggest that the sentiment has turned positive and traders are buying on dips. That will improve the prospects of a break and close above $1,743. The ETH/USDT pair is then well-positioned for a strong rally toward the psychological level of $2,000.
Contrary to this assumption, if the price turns down and breaks below the moving averages, it will indicate that the ETH/USDT pair may consolidate in a large range between $1,743 and $1,352 for some time.
BNB price analysis
BNB (BNB) turned down from the strong resistance near $318. This suggests that the bears are trying to defend the zone between $318 and $338.

A minor positive in favor of the buyers is that they have not allowed the price to break back below the 50-day simple moving average, or SMA ($306). The shallow pullback shows that every minor dip is being purchased.
The bulls will make one more attempt to catapult the price above the overhead zone. If they do that, the BNB/USDT pair can soar toward $400. Contrarily, if the price breaks below the 50-day SMA, the pair may slide to the 20-day EMA ($296). A break below this level will signal an advantage to the bears.
XRP price analysis
XRP (XRP) turned down from the 50-day SMA ($0.38) and formed a Doji candlestick pattern on March 14, indicating indecision among the bulls and the bears.

The uncertainty resolved to the downside on March 15, and the price slipped to the strong support at $0.36. If this level is taken out, the XRP/USDT pair could decline to the support line of the channel near $0.32.
On the other hand, if the price stays above $0.36, the bulls will again try to overcome the obstacle at the 50-day SMA and $0.40. If they can pull it off, the pair may pick up momentum and climb to $0.43.
Cardano price analysis
Cardano's ADA (ADA) accelerated on March 14 and reached the 50-day SMA ($0.36), but the long wick on the day’s candlestick shows that the bears are aggressively selling on rallies.

The bears tugged the price back below the 20-day EMA ($0.34) on March 15, which has cleared the path for a possible retest of $0.30. Buyers are likely to protect this level with all their might because the next support is way lower at $0.27.
Alternatively, if the price rebounds from the current level of $0.30, it will suggest that traders are buying on dips. That may keep the ADA/USDT pair range-bound between the 50-day SMA and $0.50 for a few days.
Dogecoin price analysis
Dogecoin’s (DOGE) recovery has reached the downtrend line where the bears are mounting a strong resistance.

The downsloping 20-day EMA ($0.07) and the RSI in the negative territory indicate that bears are in control. Sellers are trying to yank the price below the immediate support at $0.07. If this support collapses, the DOGE/USDT pair may descend to $0.06.
On the contrary, if the price rebounds off the current level, it will suggest that lower levels are attracting buyers. The downtrend line remains the key level on the upside because a break above it could start a relief rally to $0.10.
Polygon price analysis
The relief rally for Polygon’s MATIC (MATIC) is facing stiff resistance at the 50-day SMA ($1.22), which pulled the price below the 20-day EMA ($1.16) on March 15.

The MATIC/USDT pair could plummet to the strong support at $1.05. This is an important level to watch out for because if it cracks, the pair may retest the $0.94 support. A break below this level will open the gates for a potential drop to $0.69.
Another possibility is that the price rebounds off the $1.05 support. If that happens, the bulls will again try to drive the price above the 50-day SMA. If they succeed, the likelihood of a break above $1.30 increases.
Related: 4 signs the Bitcoin price rally could top out at $26K for now
Solana price analysis
The bears are trying to halt the rally in Solana’s SOL (SOL) at the 50-day SMA ($22.40), but the bulls are trying to keep the price above the immediate support at $19.68.

This suggests that the bulls will again try to push the price to the downtrend line. This is a vital resistance to keep an eye on because a break and close above it will signal a potential trend change. There is a minor resistance at $28, but it is likely to be crossed. The SOL/USDT pair may then surge toward $39.
Instead, if the price continues lower and falls below $19.68, it will suggest that the bears have not yet given up. The pair may then slump to the strong support at $15.28.
Polkadot price analysis
Buyers tried to drive Polkadot’s DOT (DOT) above the 50-day SMA ($6.42) on March 14, but the bears did not relent. This suggests that higher levels are attracting sellers.

Both moving averages have flattened out, and the RSI is just below the midpoint, indicating a status of equilibrium between the bulls and the bears. If the price breaks and sustains below the 20-day EMA ($6.07), the DOT/USDT pair may swing between the 50-day SMA and $5 for a few days.
If buyers kick the price above the 50-day SMA, the pair could pick up momentum and soar toward the neckline of the inverse H&S pattern. On the downside, the bears will have to sink the pair below $5 to indicate a comeback.
Shiba Inu price analysis
Shiba Inu (SHIB) is trading inside a descending channel pattern. The bulls tried to push the price above the channel, but the bears held their ground.

The bears will again try to pull the price below the psychological support at $0.000010. If they manage to do that, the SHIB/USDT pair could fall toward the support line of the channel. The bulls are likely to defend the $0.000008–$0.000007 zone with all their might.
If the price rebounds off this level, it will suggest that the pair may consolidate inside the large range between $0.000018 and $0.000007 for some more time.
In the near term, a break above the 50-day SMA ($0.000012) will tilt the advantage in favor of the bulls. The pair could then attempt a rally to $0.000014 and then to $0.000016.
This article does not contain investment advice or recommendations. Every investment and trading move involves risk, and readers should conduct their own research when making a decision.

You can get bonuses upto $100 FREE BONUS when you:
💰 Install these recommended apps:
💲 SocialGood - 100% Crypto Back on Everyday Shopping
💲 xPortal - The DeFi For The Next Billion
💲 CryptoTab Browser - Lightweight, fast, and ready to mine!
💰 Register on these recommended exchanges:
🟡 Binance🟡 Bitfinex🟡 Bitmart🟡 Bittrex🟡 Bitget
🟡 CoinEx🟡 Crypto.com🟡 Gate.io🟡 Huobi🟡 Kucoin.


Comments