Bitcoin price started a steady increase above the $36,000 resistance against the US Dollar. BTC even broke $37,000 and it is now showing positive signs.
- Bitcoin gained bullish momentum above the $35,000 and $36,000 resistance levels.
- The price is currently trading well above $36,000 and the 100 hourly simple moving average.
- There was a break above a major bearish trend line with resistance near $36,000 on the hourly chart of the BTC/USD pair (data feed from Kraken).
- The pair could correct lower, but the bulls are likely to remain active near $36,000.
Bitcoin Price Gains Pace
Bitcoin formed a base above the $34,000 zone and it started a steady increase. BTC broke the $35,000 and $36,000 resistance levels to move into a positive zone.
There was a break above a major bearish trend line with resistance near $36,000 on the hourly chart of the BTC/USD pair. The pair climbed above the 50% Fib retracement level of the key decline from the $40,420 swing high to $33,630 low.
The price even broke the $37,000 resistance zone. However, the bears are fighting near the $38,000 level. It seems like the 61.8% Fib retracement level of the key decline from the $40,420 swing high to $33,630 low is acting as a resistance.
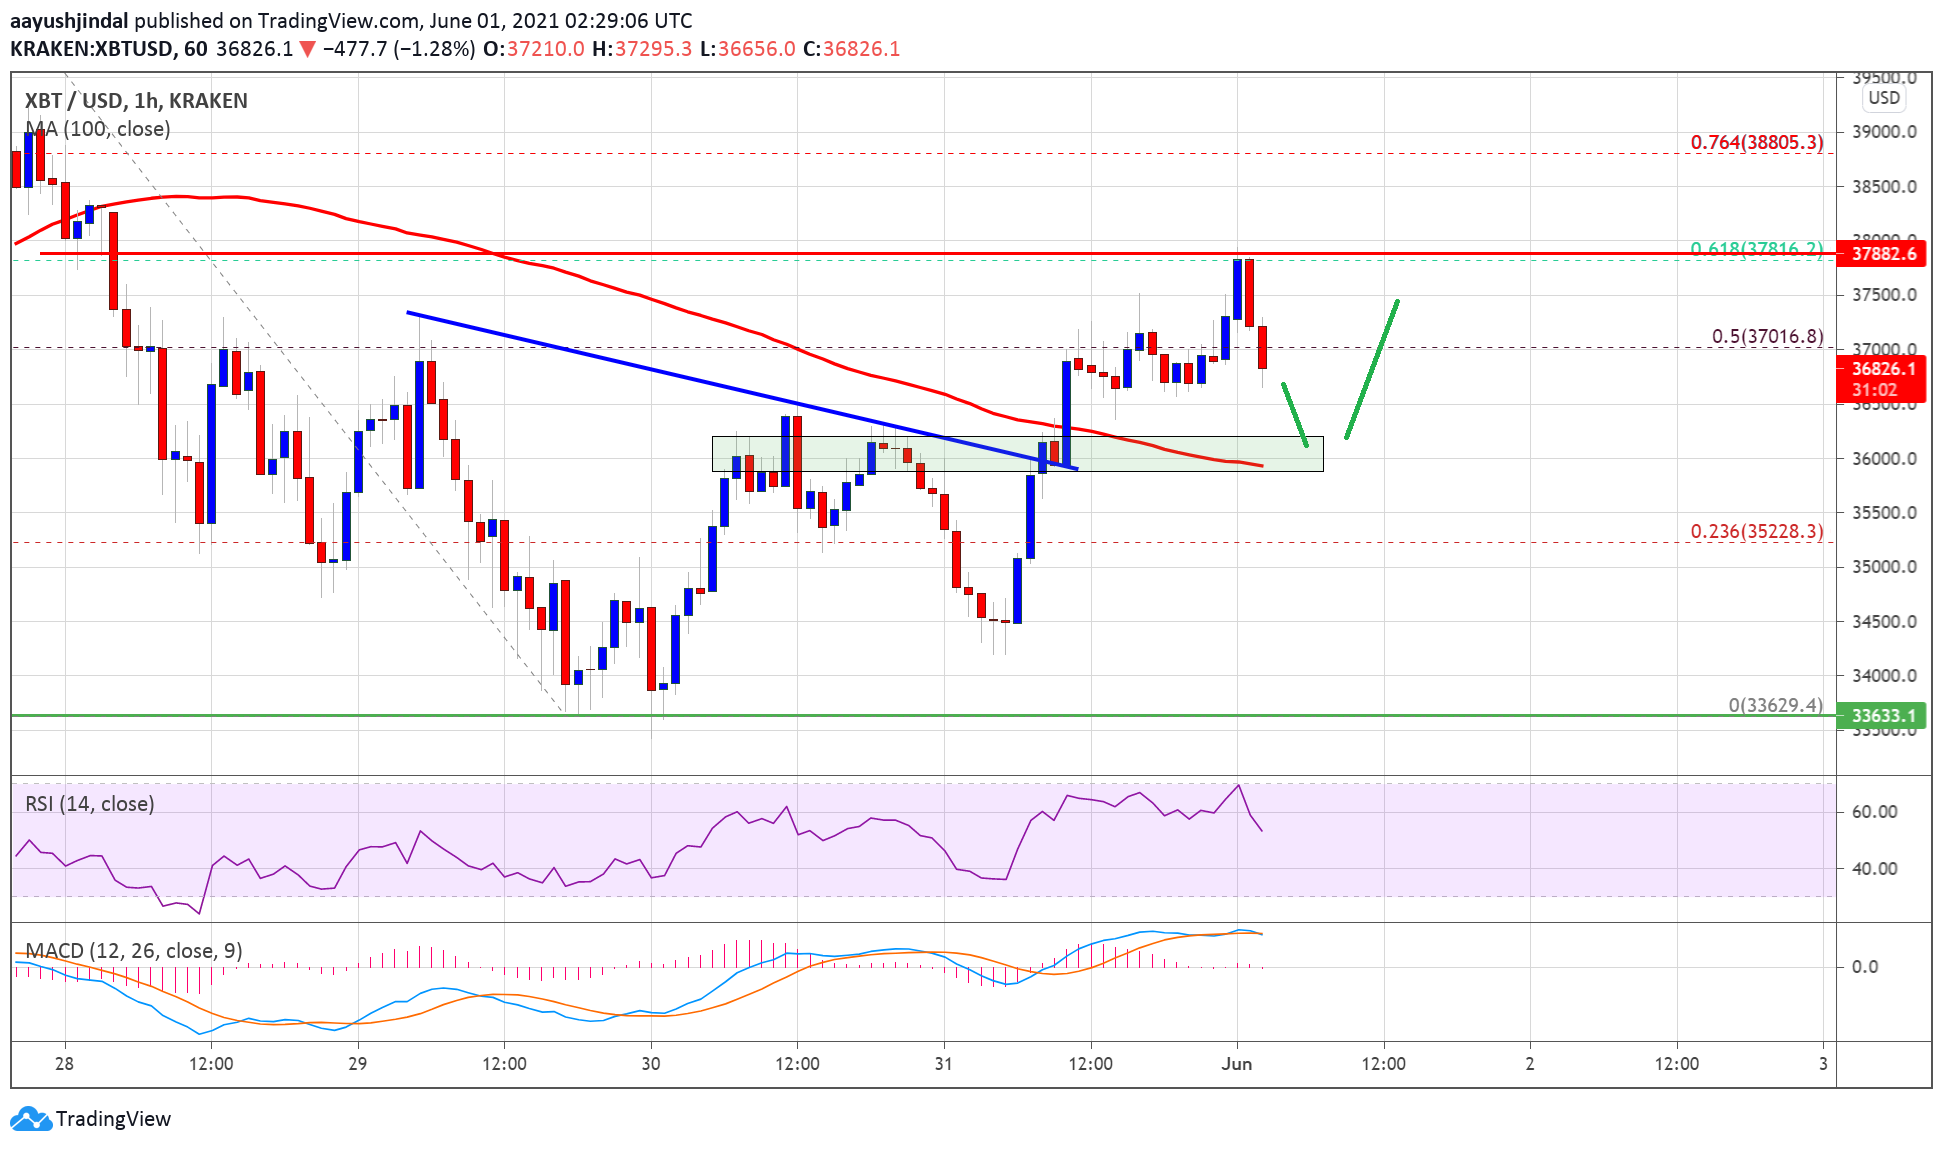
Source: BTCUSD on TradingView.com
On the upside, an immediate resistance is near the $37,500 level. The first major resistance is near the $38,000 level and the recent high. A clear break above the $38,000 zone could set the pace for a larger increase. The next major resistance is near the $40,000 level. An intermediate resistance could be near the $38,800 level.
Dips Supported in BTC?
If bitcoin fails to clear the $38,000 resistance, it could correct lower. An initial support on the downside is near the $36,500 level.
The first major support is near the $36,000 level and the 100 hourly simple moving average. If there is a downside break below the $36,000 support, the price could decline towards the $35,200 support zone in the coming sessions. Any more losses could clear the path for a retest of the $34,000 level.
Technical indicators:
Hourly MACD &- The MACD is slowly losing pace in the bullish zone.
Hourly RSI (Relative Strength Index) &- The RSI for BTC/USD is sliding towards the 50 level.
Major Support Levels &- $36,000, followed by $35,500.
Major Resistance Levels &- $37,500, $38,000 and $40,000.

You can get bonuses upto $100 FREE BONUS when you:
💰 Install these recommended apps:
💲 SocialGood - 100% Crypto Back on Everyday Shopping
💲 xPortal - The DeFi For The Next Billion
💲 CryptoTab Browser - Lightweight, fast, and ready to mine!
💰 Register on these recommended exchanges:
🟡 Binance🟡 Bitfinex🟡 Bitmart🟡 Bittrex🟡 Bitget
🟡 CoinEx🟡 Crypto.com🟡 Gate.io🟡 Huobi🟡 Kucoin.


Comments