Bitcoin corrected lower and tested the $29,000 support against the US Dollar. BTC must settle above the $30,500 resistance to start a decent increase.
- Bitcoin failed to gain pace above $31,000 and corrected lower below $30,000.
- The price is now trading above the $30,000 level and the 100 hourly simple moving average.
- There was a break above a connecting bearish trend line with resistance near $29,600 on the hourly chart of the BTC/USD pair (data feed from Kraken).
- The pair could gain bullish momentum if there is a close above the $30,500 resistance.
Bitcoin Price Faces Hurdles
Bitcoin price started a downside correction from the $31,500 zone. BTC traded below the $30,000 support zone and the 100 hourly simple moving average.
There was a move below the $29,500 level, but the bulls were active near the $29,000 zone. A low is formed near $29,060 and the price is now recovering losses. There was a clear move above the $29,500 level. The price cleared the 23.6% Fib retracement level of the recent decline from the $31,390 swing high to $29,060 low.
Bitcoin is now trading above the $30,000 level and the 100 hourly simple moving average. There was a break above a connecting bearish trend line with resistance near $29,600 on the hourly chart of the BTC/USD pair.
An immediate resistance is near the $30,300 level. It is near the 50% Fib retracement level of the recent decline from the $31,390 swing high to $29,060 low. A successful close above the $30,300 level could open the doors for a decent increase.
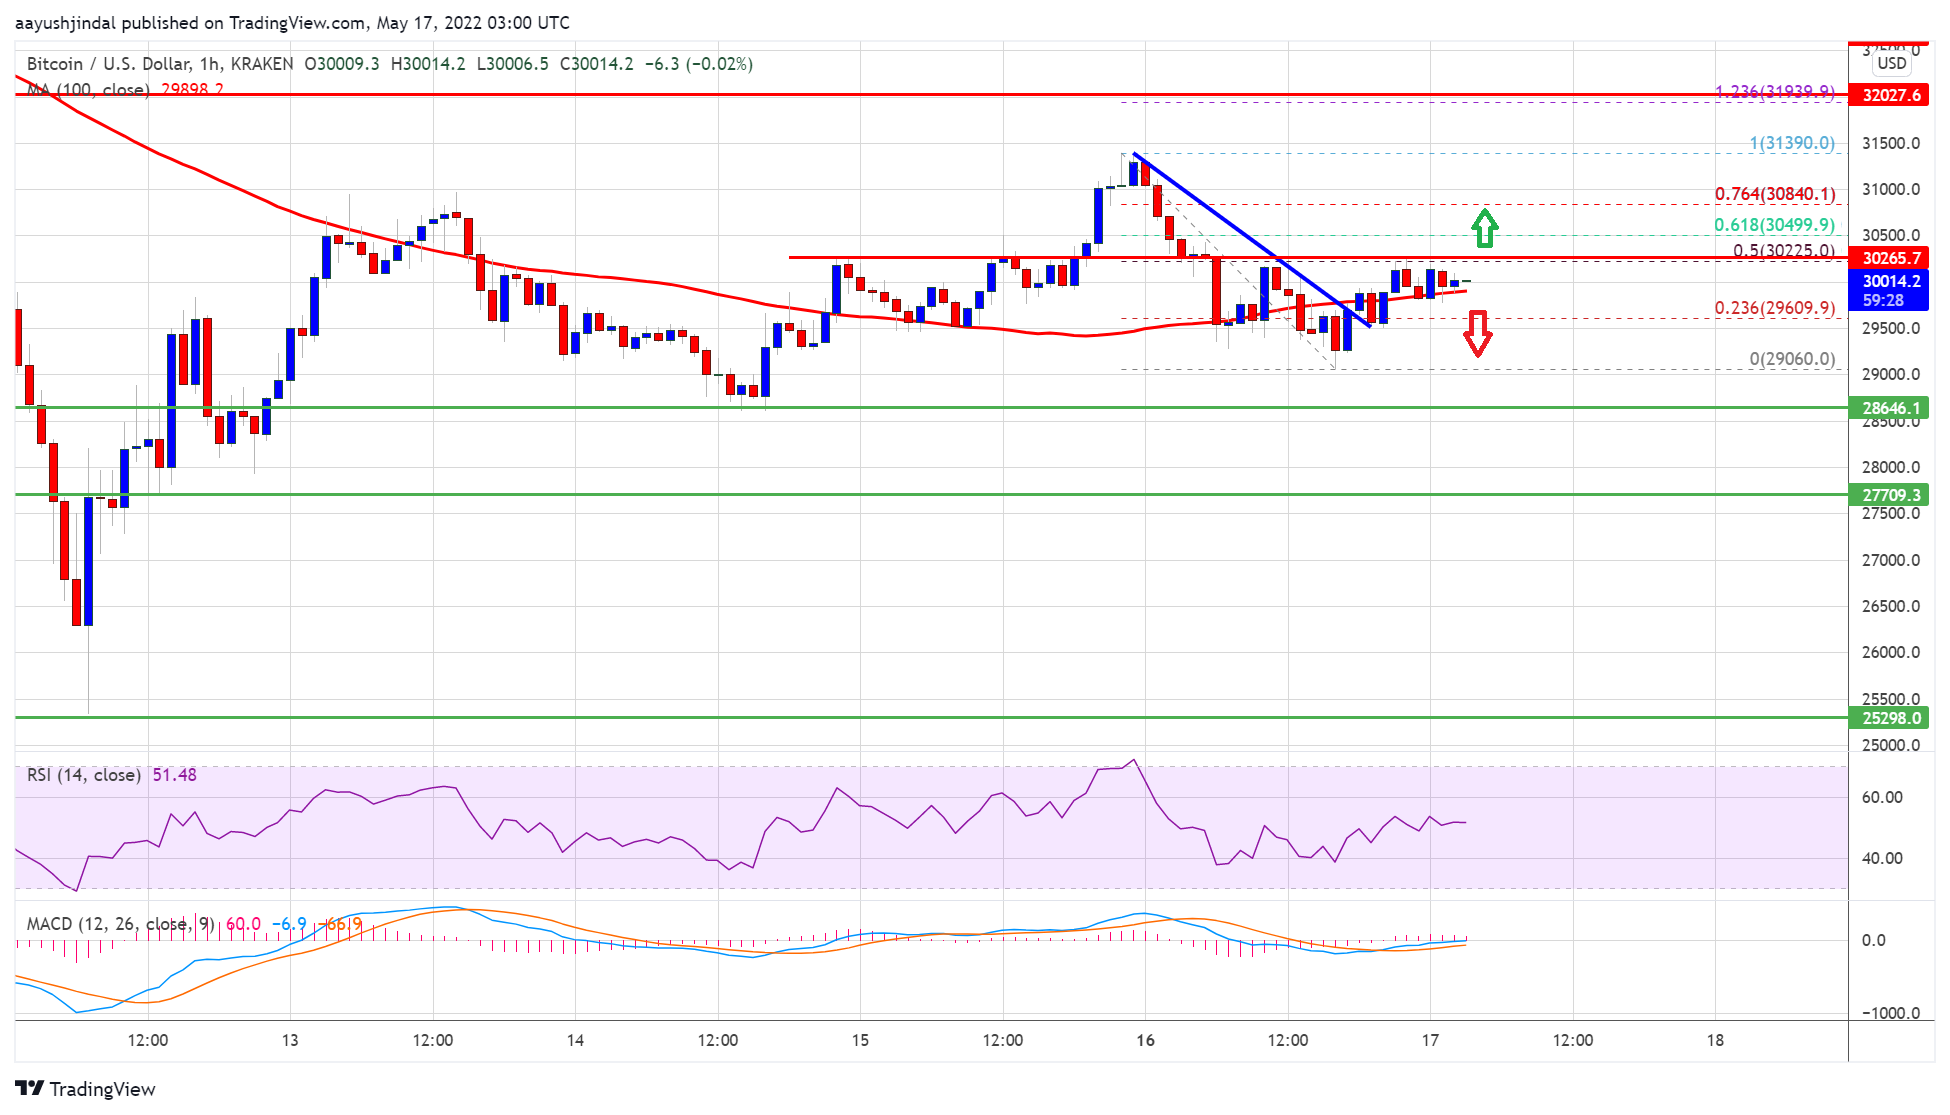
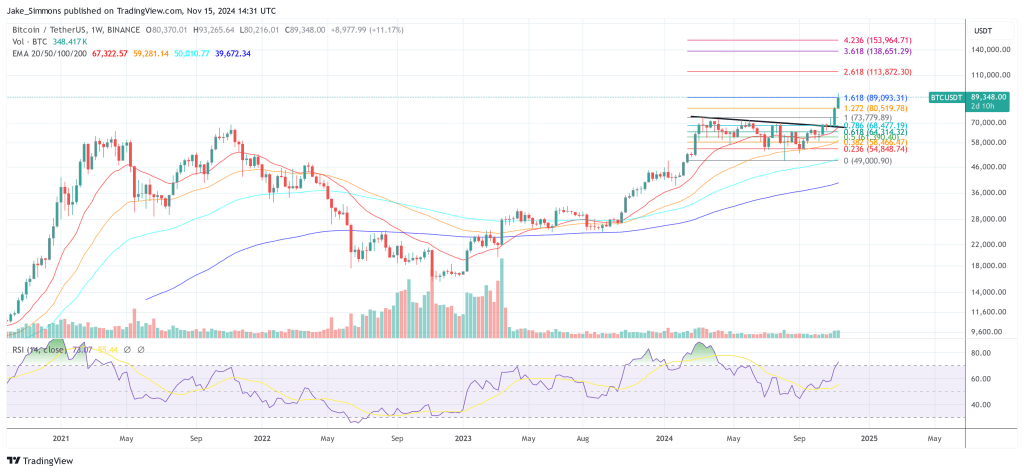
Source: BTCUSD on TradingView.com
The next major resistance is near the $31,400 level. A clear move above the $30,300 and $31,400 resistance levels might start a fresh increase in the coming sessions. The next key resistance could be near the $32,500 level, above which the price might rise towards $34,000.
Fresh Decline in BTC?
If bitcoin fails to gain pace above the $31,400 resistance zone, it could start a fresh decline. An immediate support on the downside is near the $29,600 level.
The first major support is near the $29,000 level. A downside break and close below the $29,000 support might start a major decline. In the stated case, the price could decline towards the $89,000 level.
Technical indicators:
Hourly MACD – The MACD is now slowly gaining pace in the bullish zone.
Hourly RSI (Relative Strength Index) – The RSI for BTC/USD is now above the 50 level.
Major Support Levels – $29,600, followed by $29,000.
Major Resistance Levels – $30,500, $31,400 and $32,500.
Tags: bitcoinbtcusdBTCUSDTxbtusd

You can get bonuses upto $100 FREE BONUS when you:
💰 Install these recommended apps:
💲 SocialGood - 100% Crypto Back on Everyday Shopping
💲 xPortal - The DeFi For The Next Billion
💲 CryptoTab Browser - Lightweight, fast, and ready to mine!
💰 Register on these recommended exchanges:
🟡 Binance🟡 Bitfinex🟡 Bitmart🟡 Bittrex🟡 Bitget
🟡 CoinEx🟡 Crypto.com🟡 Gate.io🟡 Huobi🟡 Kucoin.


Comments