Bitcoin extended increase above the $38,800 resistance zone against the US Dollar. BTC is now struggling near $39,200 and might correct a few points.
- Bitcoin started a fresh increase and was able to clear the $38,500 resistance zone.
- The price is now trading above $38,000 and the 100 hourly simple moving average.
- There is a key bullish trend line forming with support near $37,650 on the hourly chart of the BTC/USD pair (data feed from Kraken).
- The pair could continue to rise if it stays above the $37,500 support zone in the near term.
Bitcoin Price Consolidates
Bitcoin price remained strong above the $37,500 pivot level. BTC extended increase and was able to clear the $38,500 resistance zone.
The price even spiked above the $39,000 level and settled above the 100 hourly simple moving average. A high is formed near the $39,290 level and the price is now consolidating gains. There was a minor decline below the $38,800 level.
Bitcoin traded below the 23.6% Fib retracement level of the recent increase from the $36,665 swing low to $39,290 high. However, it is trading above $38,000 and the 100 hourly simple moving average.
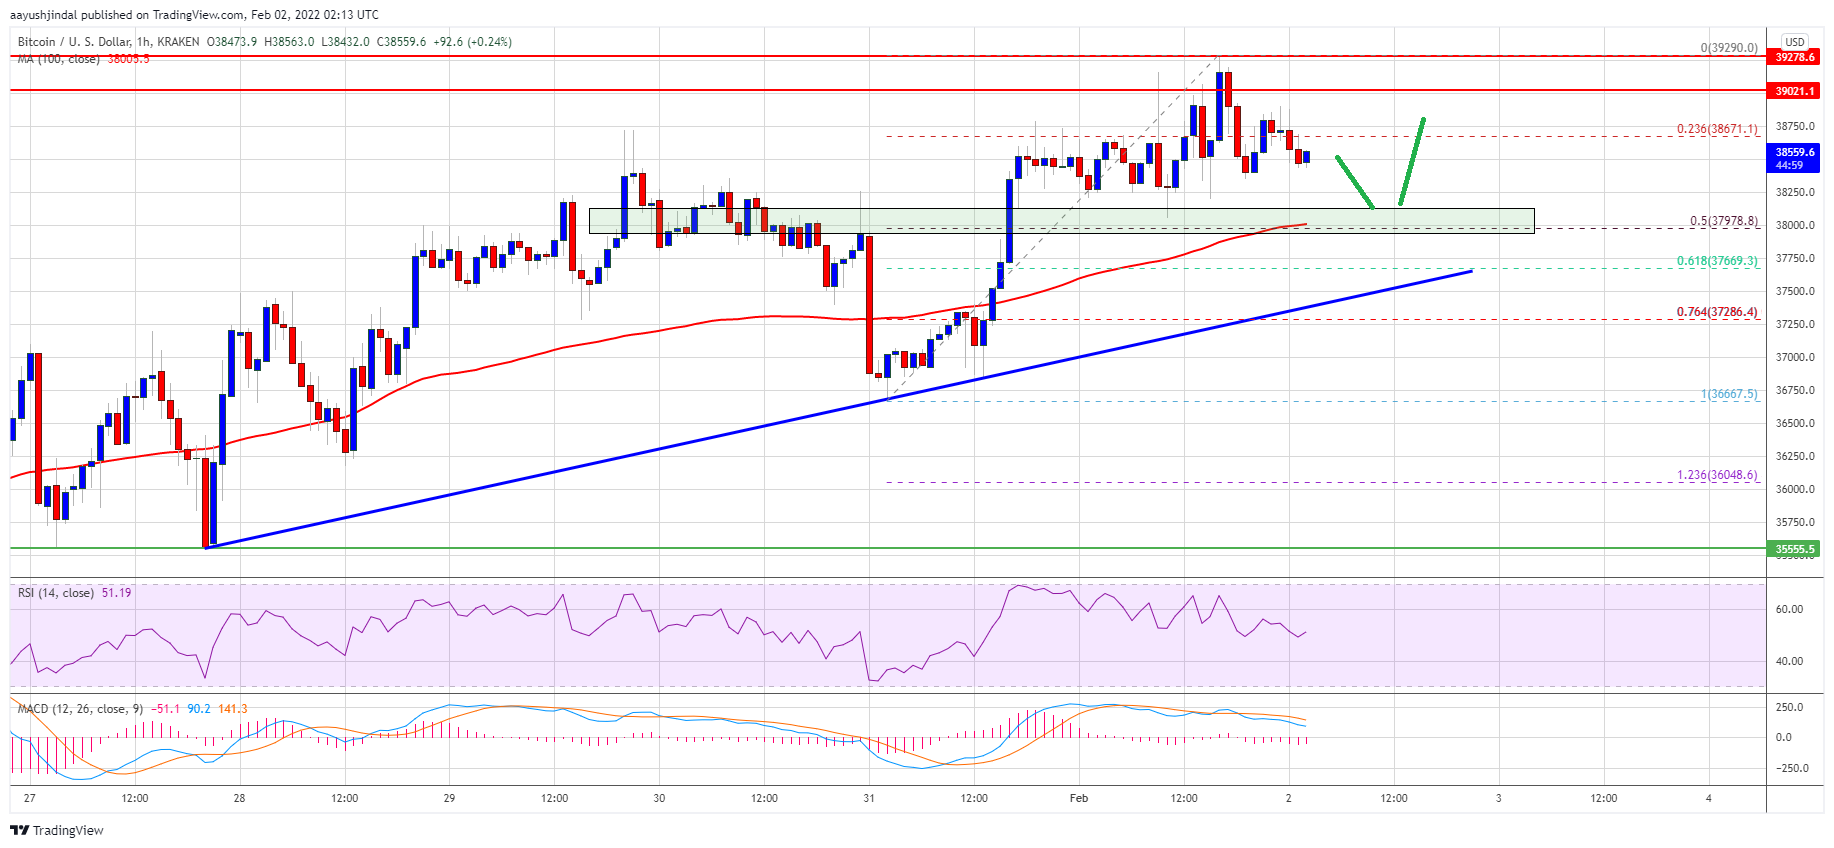
Source: BTCUSD on TradingView.com
On the upside, an initial resistance is near the $38,800 level. The first major resistance is near the $39,200 zone. A clear move above the $39,200 zone might push the price towards the $40,000 resistance zone. Any more gains may perhaps open the doors for a larger increase in the coming sessions. The next major resistance above $40,000 might be near the $41,200 level.
Downsides Limited in BTC?
If bitcoin fails to start a fresh increase above $39,200, it could start a downside correction. An immediate support on the downside is near the $38,500 zone.
The first major support is seen near the $38,000 zone. It is near the 50% Fib retracement level of the recent increase from the $36,665 swing low to $39,290 high. The main support is near the trend line and $37,500. A downside break below the $37,500 support zone may perhaps call for a sharp decline in the near term.
Technical indicators:
Hourly MACD – The MACD is now losing momentum in the bullish zone.
Hourly RSI (Relative Strength Index) – The RSI for BTC/USD is still above the 50 level.
Major Support Levels – $38,000, followed by $37,500.
Major Resistance Levels – $38,800, $39,200 and $40,000.
Tags: bitcoinbtcusdBTCUSDTxbtusd

You can get bonuses upto $100 FREE BONUS when you:
💰 Install these recommended apps:
💲 SocialGood - 100% Crypto Back on Everyday Shopping
💲 xPortal - The DeFi For The Next Billion
💲 CryptoTab Browser - Lightweight, fast, and ready to mine!
💰 Register on these recommended exchanges:
🟡 Binance🟡 Bitfinex🟡 Bitmart🟡 Bittrex🟡 Bitget
🟡 CoinEx🟡 Crypto.com🟡 Gate.io🟡 Huobi🟡 Kucoin.


Comments