Bitcoin price extended its decline below the $33,500 support against the US Dollar. BTC is now consolidating above $32,200, below which it could accelerate lower.
- Bitcoin started a fresh decline below the $33,500 and $33,200 support levels.
- The price is now trading below the $33,000 support and the 100 hourly simple moving average.
- There is a short-term contracting triangle forming with resistance near $33,000 on the hourly chart of the BTC/USD pair (data feed from Kraken).
- The pair could correct higher, but the bulls are likely to face resistance near $33,500.
Bitcoin Price Testing Key Support
Bitcoin failed to stay above the $33,500 support and it extended its decline. BTC even broke the $33,000 support zone and it settled well below the 100 hourly simple moving average.
The price even spiked below $32,200, but there was no follow through move. It is now consolidating losses above the $32,200 support zone. It is now approaching the 23.6% Fib retracement level of the recent decline from the $35,975 swing high to $32,150 low.
There is also a short-term contracting triangle forming with resistance near $33,000 on the hourly chart of the BTC/USD pair. The triangle support is near the $32,200 zone.
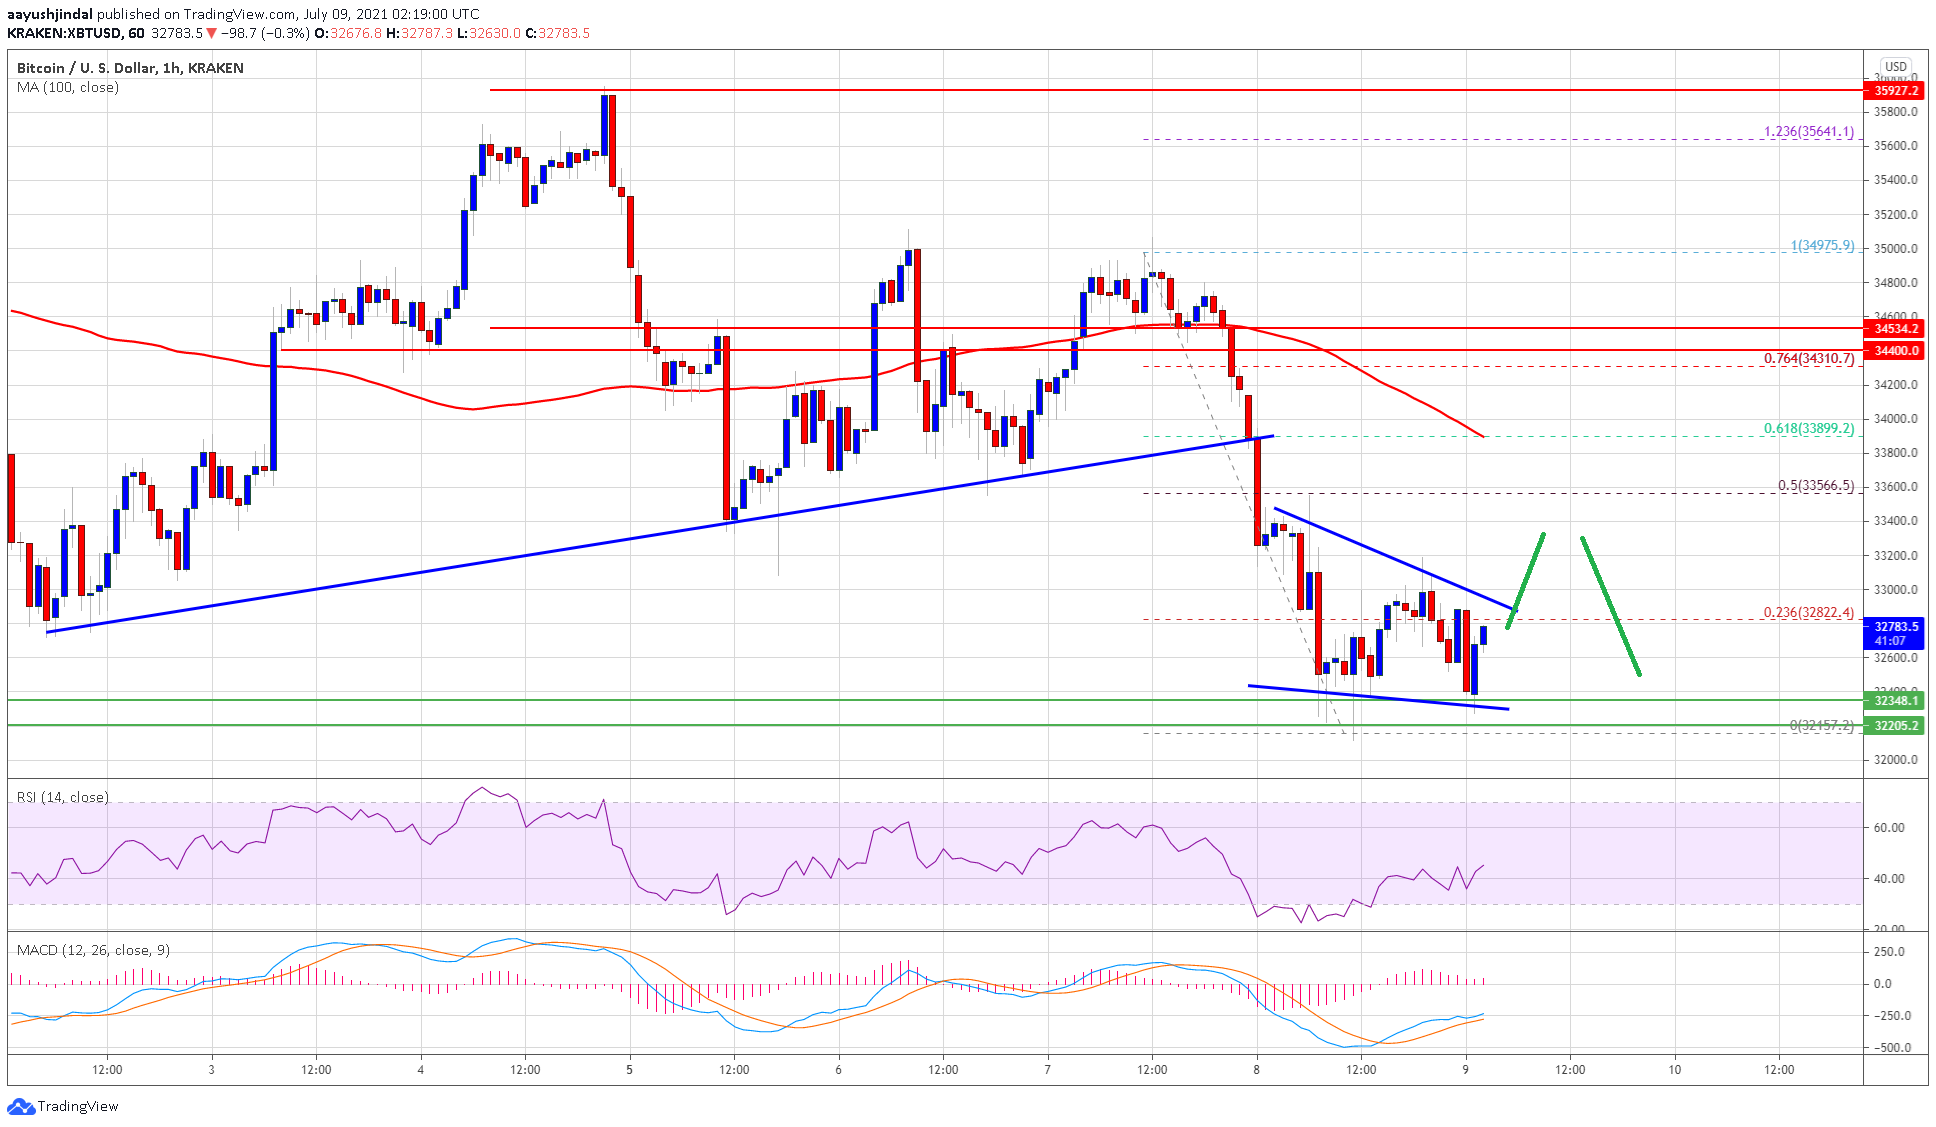
Source: BTCUSD on TradingView.com
Therefore, the first major support is near the $32,200 zone. The next key support is near the $32,000 level. If bitcoin price fails to stay above the $32,000 support, there could be a sharp decline. The next major support is near the $30,500 level. Any more losses might push the price below the main $30,000 support zone in the near term.
Upsides Limited in BTC?
If bitcoin remains stable above the $32,000 support zone, it could start an upside correction. An immediate resistance on the upside is near the $33,000 level.
The first major resistance is near $33,500. It is near the 50% Fib retracement level of the recent decline from the $35,975 swing high to $32,150 low. If there is a close above the $33,500 resistance zone, the price could rise towards the $34,000 resistance. The main hurdle is still near the $35,000 zone.
Technical indicators:
Hourly MACD &- The MACD is now losing pace in the bearish zone.
Hourly RSI (Relative Strength Index) &- The RSI for BTC/USD is now rising towards the 50 level.
Major Support Levels &- $32,000, followed by $31,200.
Major Resistance Levels &- $33,000, $33,500 and $34,000.

You can get bonuses upto $100 FREE BONUS when you:
💰 Install these recommended apps:
💲 SocialGood - 100% Crypto Back on Everyday Shopping
💲 xPortal - The DeFi For The Next Billion
💲 CryptoTab Browser - Lightweight, fast, and ready to mine!
💰 Register on these recommended exchanges:
🟡 Binance🟡 Bitfinex🟡 Bitmart🟡 Bittrex🟡 Bitget
🟡 CoinEx🟡 Crypto.com🟡 Gate.io🟡 Huobi🟡 Kucoin.


Comments