Bitcoin price extended its upward move above the $37,500 resistance against the US Dollar. BTC failed to clear $38,500 and it is now correcting lower.
- Bitcoin traded above $38,000, but it failed to continue higher above $38,500.
- The price is currently well above $35,000 and the 100 hourly simple moving average.
- There was a break below a key bullish trend line with support near $36,500 on the hourly chart of the BTC/USD pair (data feed from Kraken).
- The pair could extend its decline, but the bulls are likely to remain active near $35,000.
Bitcoin Price Correcting Gains
Bitcoin settled well above the $35,000 and extended its upward move. BTC even broke the $37,500 resistance, but the bulls failed to gain strength for a break of the $38,500 hurdle.
A high was formed near $38,425 and the price is now moving lower. It broke the $37,000 support level to start the current correction. There was a break below the 23.6% Fib retracement level of the upward wave from the $31,052 swing low to $38,423 high.
Besides, there was a break below a key bullish trend line with support near $36,500 on the hourly chart of the BTC/USD pair. However, the pair is still well above $35,000 and the 100 hourly simple moving average.
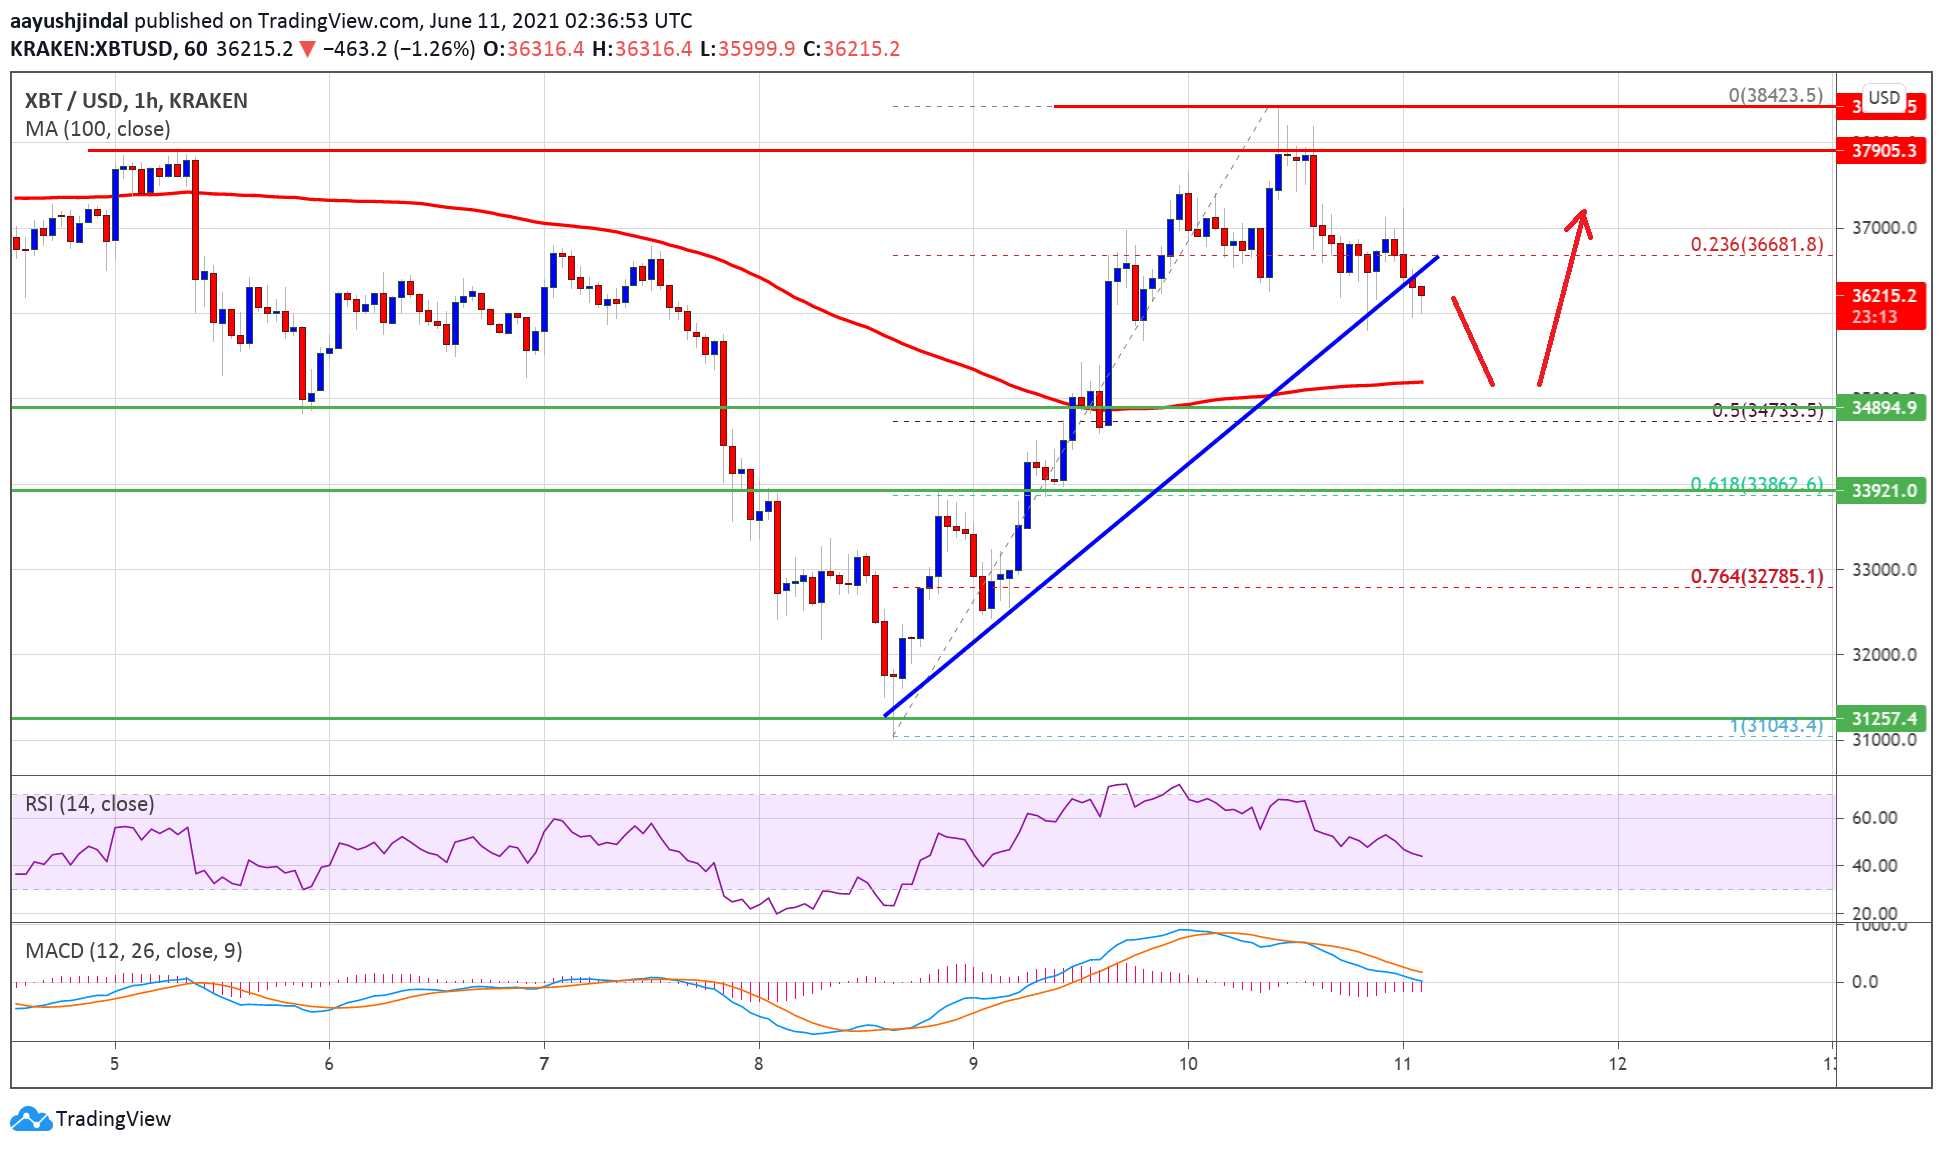
Source: BTCUSD on TradingView.com
On the upside, an initial resistance is near the $37,000 level. The first major resistance is near the $37,500 level, above which the price likely to revisit the $38,500 resistance zone in the near term. The main resistance is still near the $40,000 level.
Dips Supported in BTC?
If bitcoin fails to clear the $37,500 resistance, it could extend its decline. An initial support on the downside is near the $36,000 level.
The first major support is near the $35,500 level. The main support is now forming near the $35,000 level and the 100 hourly SMA. It is close to the 50% Fib retracement level of the upward wave from the $31,052 swing low to $38,423 high. A downside break below the $35,000 support zone could push the price back into a bearish zone.
Technical indicators:
Hourly MACD &- The MACD is now losing pace in the bullish zone.
Hourly RSI (Relative Strength Index) &- The RSI for BTC/USD is now below the 50 level.
Major Support Levels &- $36,000, followed by $35,000.
Major Resistance Levels &- $37,500, $38,500 and $40,000.

You can get bonuses upto $100 FREE BONUS when you:
💰 Install these recommended apps:
💲 SocialGood - 100% Crypto Back on Everyday Shopping
💲 xPortal - The DeFi For The Next Billion
💲 CryptoTab Browser - Lightweight, fast, and ready to mine!
💰 Register on these recommended exchanges:
🟡 Binance🟡 Bitfinex🟡 Bitmart🟡 Bittrex🟡 Bitget
🟡 CoinEx🟡 Crypto.com🟡 Gate.io🟡 Huobi🟡 Kucoin.


Comments