Bitcoin price failed to clear the $35,000 resistance and started a fresh decline against the US Dollar. BTC remains at a risk of a larger decline as long as it is below $34,000.
- Bitcoin failed to extend gains above $34,650 and it started a fresh decline below $34,000.
- The price is now trading below the $33,500 support and the 100 hourly simple moving average.
- There was a break below a key bullish trend line with support near $33,900 on the hourly chart of the BTC/USD pair (data feed from Kraken).
- The pair could correct losses, but it might face sellers near $34,000 and the 100 hourly SMA.
Bitcoin Price Dives Again
Yesterday, we saw a decent increase in bitcoin above the $33,500 and $34,000 resistance levels. BTC even climbed above the $34,500 level, but it failed to extend gains.
A high was formed near $34,676 before the price started a fresh decline. It broke the $34,000 support level and settled below the 100 hourly simple moving average. There was also a break below a key bullish trend line with support near $33,900 on the hourly chart of the BTC/USD pair.
The pair spiked below the $33,000 level and traded as low as $32,675. Bitcoin is now correcting losses and trading above $33,000. It is testing the 23.6% Fib retracement level of the recent decline from the $34,676 high to $32,675 low.
The first major resistance is near the $33,500 level and the 100 hourly SMA. The 50% Fib retracement level of the recent decline from the $34,676 high to $32,675 low is also near the $33,600 level.
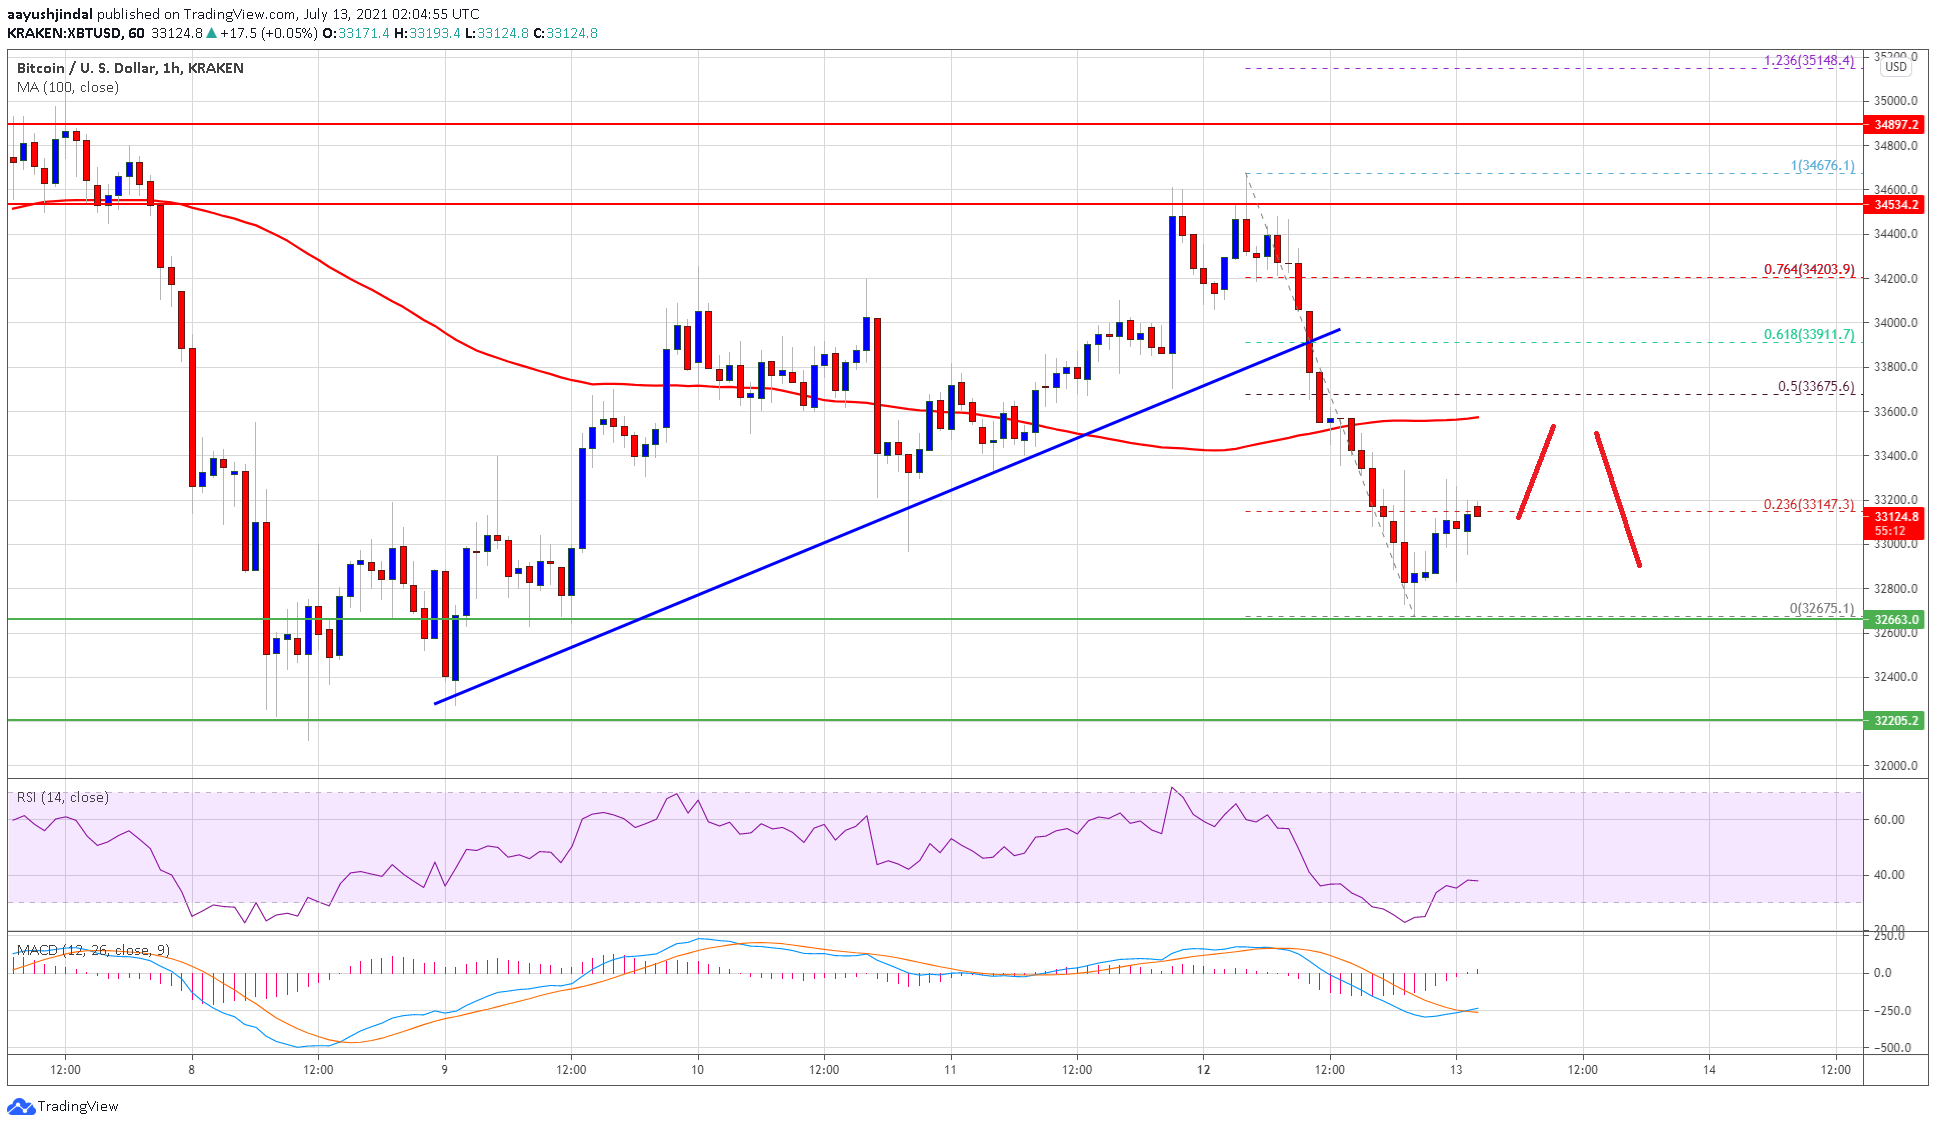
Source: BTCUSD on TradingView.com
The main resistance is now near the $34,000 level. A close above the $34,000 level is needed to avoid more downsides in the near term.
More Losses in BTC?
If bitcoin fails to recover above the $33,500 and $34,000 resistance levels, there is a risk of a larger decline. An initial support on the downside is near the $32,650 level.
The first major support is near the $32,500 level. The main support is still near the $32,200 level, below which the price might easily dive towards the $30,000 level.
Technical indicators:
Hourly MACD &- The MACD is slowly moving into the bullish zone.
Hourly RSI (Relative Strength Index) &- The RSI for BTC/USD is now well below the 50 level.
Major Support Levels &- $32,500, followed by $32,200.
Major Resistance Levels &- $33,500, $33,650 and $34,000.

You can get bonuses upto $100 FREE BONUS when you:
💰 Install these recommended apps:
💲 SocialGood - 100% Crypto Back on Everyday Shopping
💲 xPortal - The DeFi For The Next Billion
💲 CryptoTab Browser - Lightweight, fast, and ready to mine!
💰 Register on these recommended exchanges:
🟡 Binance🟡 Bitfinex🟡 Bitmart🟡 Bittrex🟡 Bitget
🟡 CoinEx🟡 Crypto.com🟡 Gate.io🟡 Huobi🟡 Kucoin.


Comments