Ethereum extended its upward move above the $2,550 resistance zone against the US Dollar. ETH price settled above the 100 hourly SMA and it might continue to rise.
- Ethereum extended its recovery wave above the $2,550 and $2,600 levels.
- The price is now trading above the $2,500 support and the 100 hourly simple moving average.
- There was a break above a crucial bearish trend line with resistance near $2,250 on the hourly chart of ETH/USD (data feed via Kraken).
- The pair is now showing positive signs above $2,500, but it is also facing hurdles near $2,760.
Ethereum Price Gains Traction
Ethereum remained supported above the $2,200 level and it started a steady recovery wave. There was a break above a couple of important hurdles near the $2,250 level.
There was also a break above a crucial bearish trend line with resistance near $2,250 on the hourly chart of ETH/USD. It opened the doors for a strong move above the $2,500 level and the 100 hourly simple moving average.
Ether even cleared the $2,600 and $2,700 levels. It traded as high as $2,7608 before starting a downside correction. The price corrected lower below the $2,700 level.
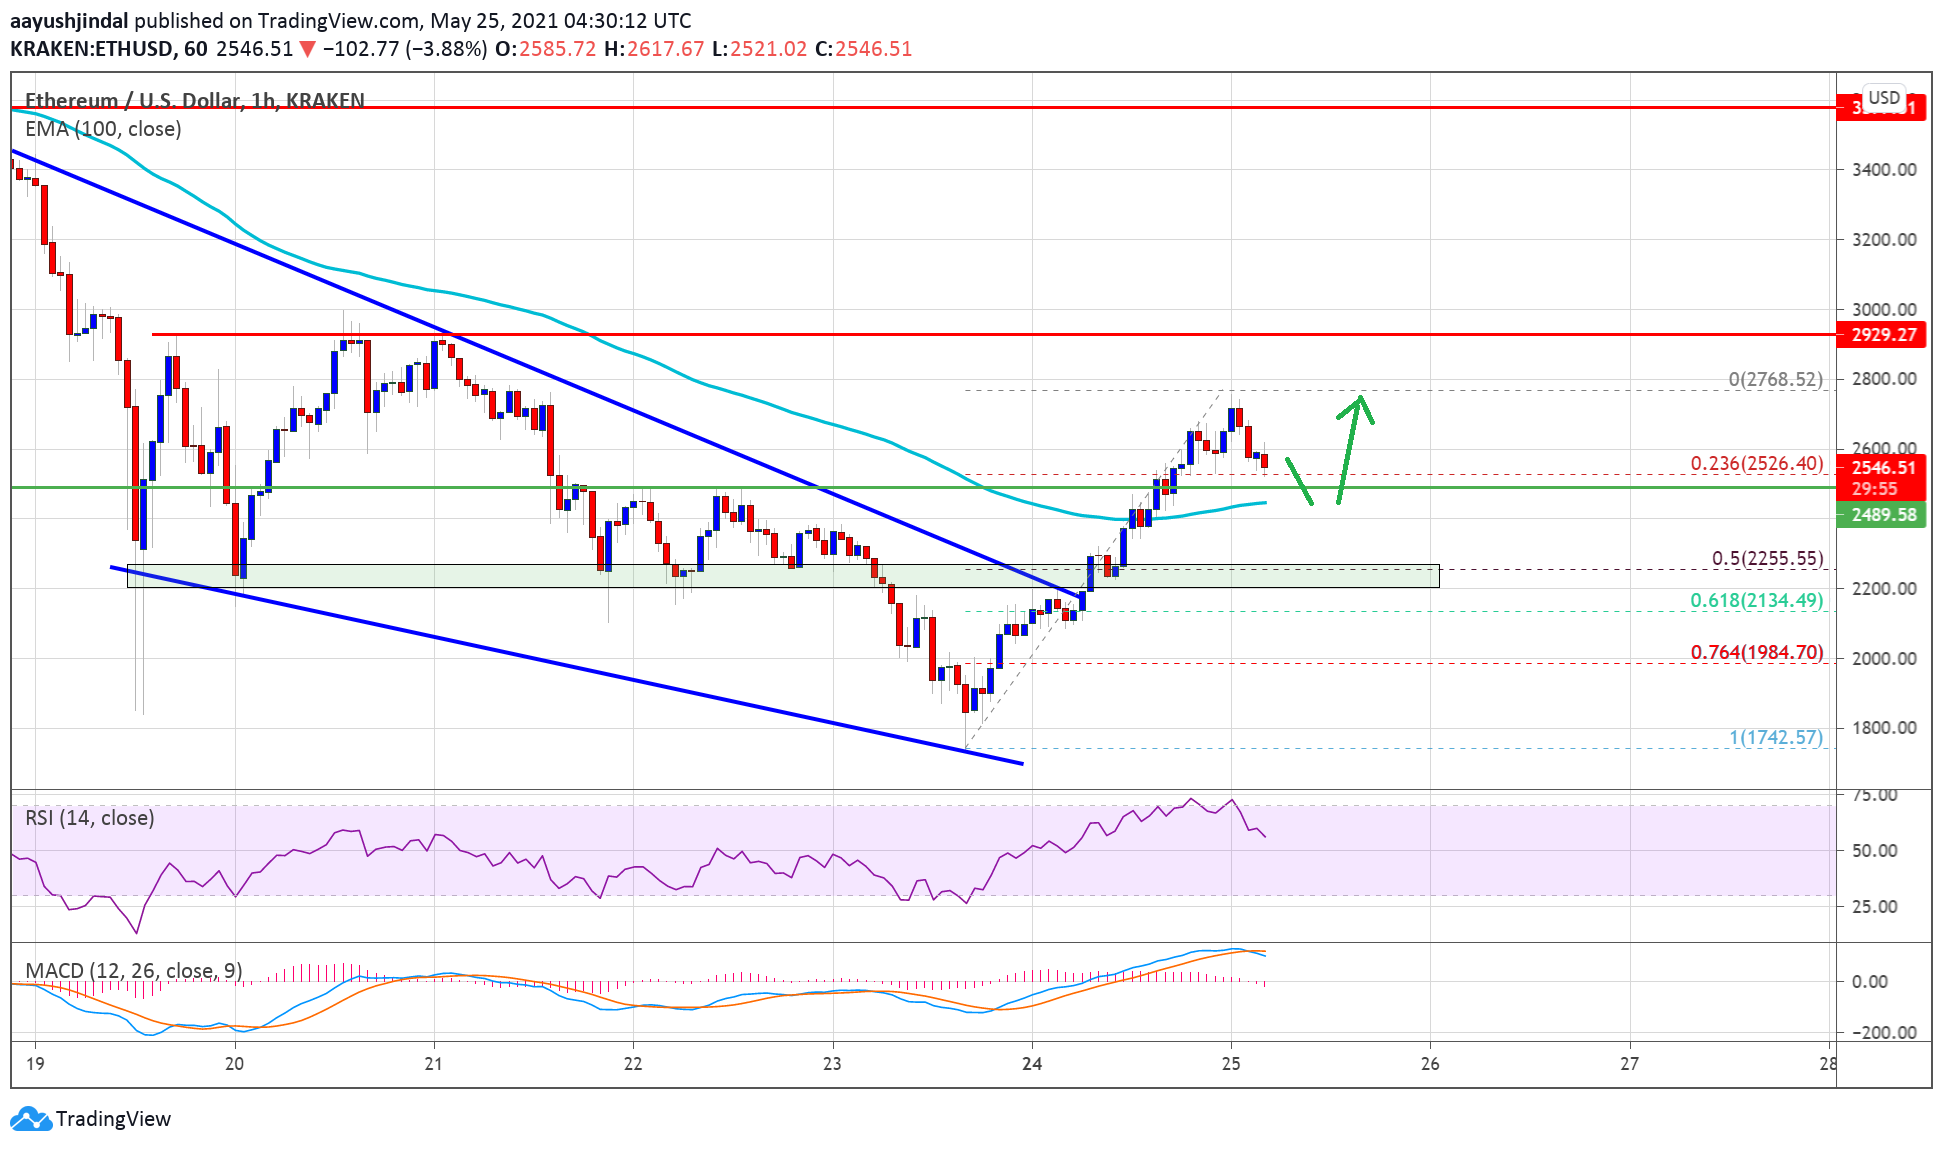
Source: ETHUSD on TradingView.com
An immediate support is near the $2,525 level. It is near the 23.6% Fib retracement level of the upward move from the $1,740 swing low to $2,768 high. The first major support is near the $2,480 level and the 100 hourly simple moving average.
On the upside, the first major resistance is near the $2,750 level. A clear break above the recent high could lead the price towards the $2,930 resistance. The next key resistance is near $3,000. Any more gains might call for a test of the $3,200 level.
Fresh Decline in ETH?
If Ethereum fails to continue higher above the $2,700 and $2,760 resistance levels, it could start another decline. An initial support on the downside is near the $2,500 zone.
The first key support is near the $2,480 level and the 100 hourly SMA. The main support is now forming near the $2,255 level. It is near the 50% Fib retracement level of the upward move from the $1,740 swing low to $2,768 high.
Technical Indicators
Hourly MACD &- The MACD for ETH/USD is slowly losing pace in the bullish zone.
Hourly RSI &- The RSI for ETH/USD is moving lower towards the 50 level.
Major Support Level &- $2,480
Major Resistance Level &- $2,760

You can get bonuses upto $100 FREE BONUS when you:
💰 Install these recommended apps:
💲 SocialGood - 100% Crypto Back on Everyday Shopping
💲 xPortal - The DeFi For The Next Billion
💲 CryptoTab Browser - Lightweight, fast, and ready to mine!
💰 Register on these recommended exchanges:
🟡 Binance🟡 Bitfinex🟡 Bitmart🟡 Bittrex🟡 Bitget
🟡 CoinEx🟡 Crypto.com🟡 Gate.io🟡 Huobi🟡 Kucoin.


Comments