Ethereum failed to continue above $2,900 against the US Dollar. ETH price corrected gains and it is now trading near a major support at $2,640 and the 100 hourly SMA.
- Ethereum broke the $2,850 resistance, but it failed to gain pace above $2,900.
- The price is now testing the $2,650 support and the 100 hourly simple moving average.
- There was a break below a key bullish trend line with support at $2,750 on the hourly chart of ETH/USD (data feed via Kraken).
- The pair must stay above the 100 hourly SMA to avoid a drop towards the $2,380 support.
Ethereum Price Reaches Key Support
Ethereum extended its recovery wave above the $2,800 and $2,850 resistance levels. ETH even pushed above the $2,900 level and settled nicely above the 100 hourly simple moving average.
However, it failed to gain pace above $2,900. The bulls made two attempts to push the price above the $2,920 level, but they failed. The recent high was formed near $2,912 before the price started a downside correction.
Ether corrected lower below the $2,850 and $2,800 support levels. There was a break below a key bullish trend line with support at $2,750 on the hourly chart of ETH/USD. The pair even declined below the 23.6% Fib retracement level of the upward move from the $2,370 swing low to $2,912 high.
Ether price is now testing the $2,650 support and the 100 hourly simple moving average. It is close to the 50% Fib retracement level of the upward move from the $2,370 swing low to $2,912 high.
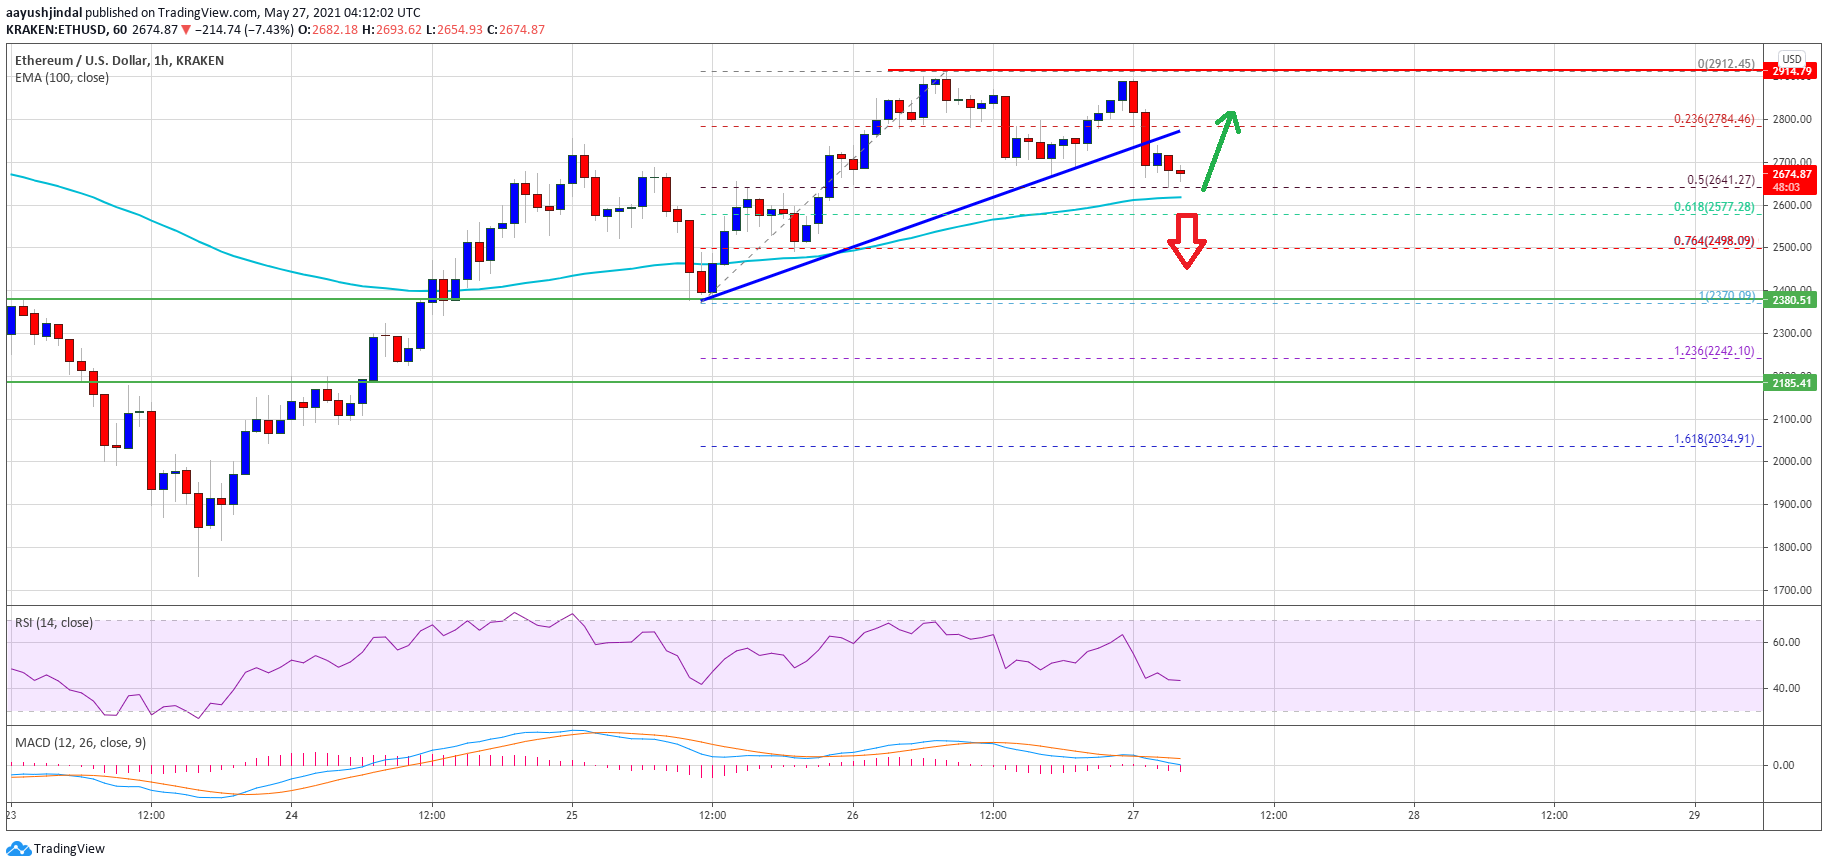
Source: ETHUSD on TradingView.com
On the upside, an immediate resistance is near the broken trend line at $2,800. The next major resistance is near the $2,900 level, above which the price could attempt a move towards the $3,000 resistance zone.
More Losses in ETH?
If Ethereum fails to continue higher above the $2,800 and $2,900 resistance levels, it could extend its decline. An initial support on the downside is near the $2,650 zone and the 100 hourly SMA.
A downside break below the 100 hourly SMA might spark a larger decline. The next key support is near the $2,380 level. Any more losses could lead the price towards the $2,185 support zone.
Technical Indicators
Hourly MACD &- The MACD for ETH/USD is slowly losing pace in the bullish zone.
Hourly RSI &- The RSI for ETH/USD is currently below the 50 level.
Major Support Level &- $2,650
Major Resistance Level &- $2,800

You can get bonuses upto $100 FREE BONUS when you:
💰 Install these recommended apps:
💲 SocialGood - 100% Crypto Back on Everyday Shopping
💲 xPortal - The DeFi For The Next Billion
💲 CryptoTab Browser - Lightweight, fast, and ready to mine!
💰 Register on these recommended exchanges:
🟡 Binance🟡 Bitfinex🟡 Bitmart🟡 Bittrex🟡 Bitget
🟡 CoinEx🟡 Crypto.com🟡 Gate.io🟡 Huobi🟡 Kucoin.


Comments