Ethereum started a steady increase and cleared the $2,550 resistance against the US Dollar. ETH price is now struggling to climb higher above $2,650 and the 100 hourly SMA.
- Ethereum gained pace for a move above the $2,500 and $2,550 resistance levels.
- The price is struggling to settle above $2,600 and the 100 hourly simple moving average.
- There is a key bullish trend line forming with support near $2,500 on the hourly chart of ETH/USD (data feed via Kraken).
- The pair must settle above $2,600 and the 100 hourly SMA to continue higher in the near term.
Ethereum Price is Facing Hurdles
Ethereum settled above the $2,450 level and extended its upward move. ETH broke the $2,500 and $2,550 resistance levels to move into a positive zone.
There was a break above the 50% Fib retracement level of the of the key decline drop from the $2,850 swing high to $2,310 low. The price even spiked above the $2,600 level and the 100 hourly simple moving average. However, ether failed to remain stable above $2,600.
It is now trading below the $2,600 level and the 100 hourly simple moving average. It seems like there is a bullish trend line forming with support near $2,500 on the hourly chart of ETH/USD.
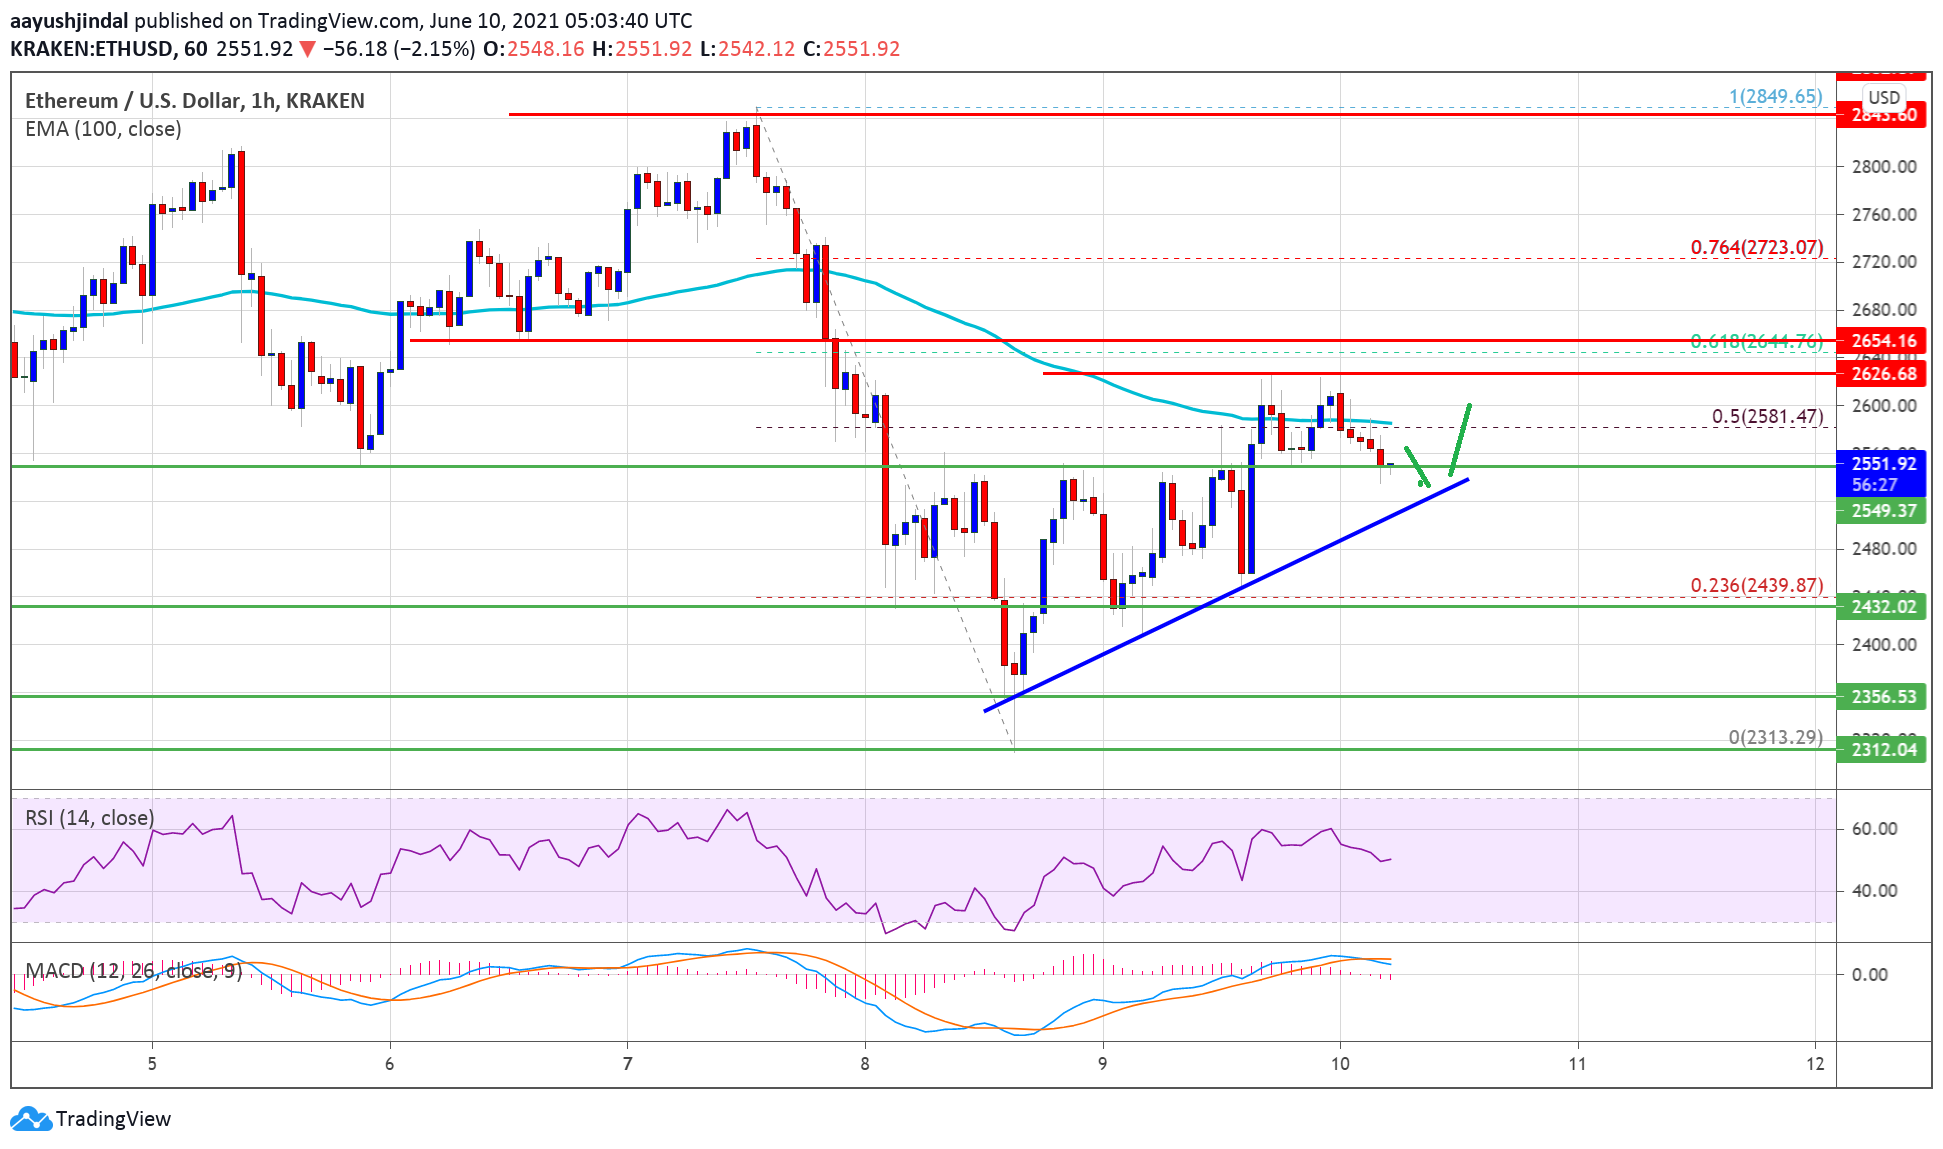
Source: ETHUSD on TradingView.com
On the upside, the price must settle above the $2,600 level and the 100 hourly SMA. The next key resistance is near the $2,650 level. It is close to the 61.8% Fib retracement level of the of the key decline drop from the $2,850 swing high to $2,310 low.
A clear upside break above $2,600 and $2,650 could start a strong increase in the near term. The next major resistance could be $2,720, above which the price might revisit the $2,880 level.
Dips Limited in ETH?
If Ethereum fails to clear the $2,600 and $2,650 resistance levels, it could correct lower. An initial support on the downside is near the $2,550 level.
The first major support is near the $2,500 level and the trend line. A downside break below the trend line could increase selling pressure and ether might drop towards $2,400.
Technical Indicators
Hourly MACD &- The MACD for ETH/USD is slowly losing pace in the bullish zone.
Hourly RSI &- The RSI for ETH/USD is currently near the 50 level.
Major Support Level &- $2,500
Major Resistance Level &- $2,650

You can get bonuses upto $100 FREE BONUS when you:
💰 Install these recommended apps:
💲 SocialGood - 100% Crypto Back on Everyday Shopping
💲 xPortal - The DeFi For The Next Billion
💲 CryptoTab Browser - Lightweight, fast, and ready to mine!
💰 Register on these recommended exchanges:
🟡 Binance🟡 Bitfinex🟡 Bitmart🟡 Bittrex🟡 Bitget
🟡 CoinEx🟡 Crypto.com🟡 Gate.io🟡 Huobi🟡 Kucoin.


Comments