Past trend of the Ethereum value captured per byte metric suggests that a 50% drawdown from here is still possible for ETH.
Ethereum Value Captured Per Byte Currently Stands At $0.30, Double The Previous Bear Bottoms
As per the latest data released by Glassnode, ETH may still possibly have potential for a further 50% plummet in the price.
The “value per byte” is an indicator that measures the total value stored by Ethereum within a single blockchain byte.
The metric was first coined by Permabull Niño, and its main goal is to model how the value capture-to-data efficiency of a blockchain changes over time.
When the value of this indicator is high, it means the crypto is capturing a large amount of value relative to a small data footprint right now.
Related Reading | Ethereum Hashrate Plunges Over 10% As Mining Profitability Drops
Such a value can hint that the blockchain is very efficient at the moment. On the other hand, a low value being stored per byte suggests poor efficiency.
Now, here is a chart that shows the trend in the Ethereum value captured per byte over the last few years:
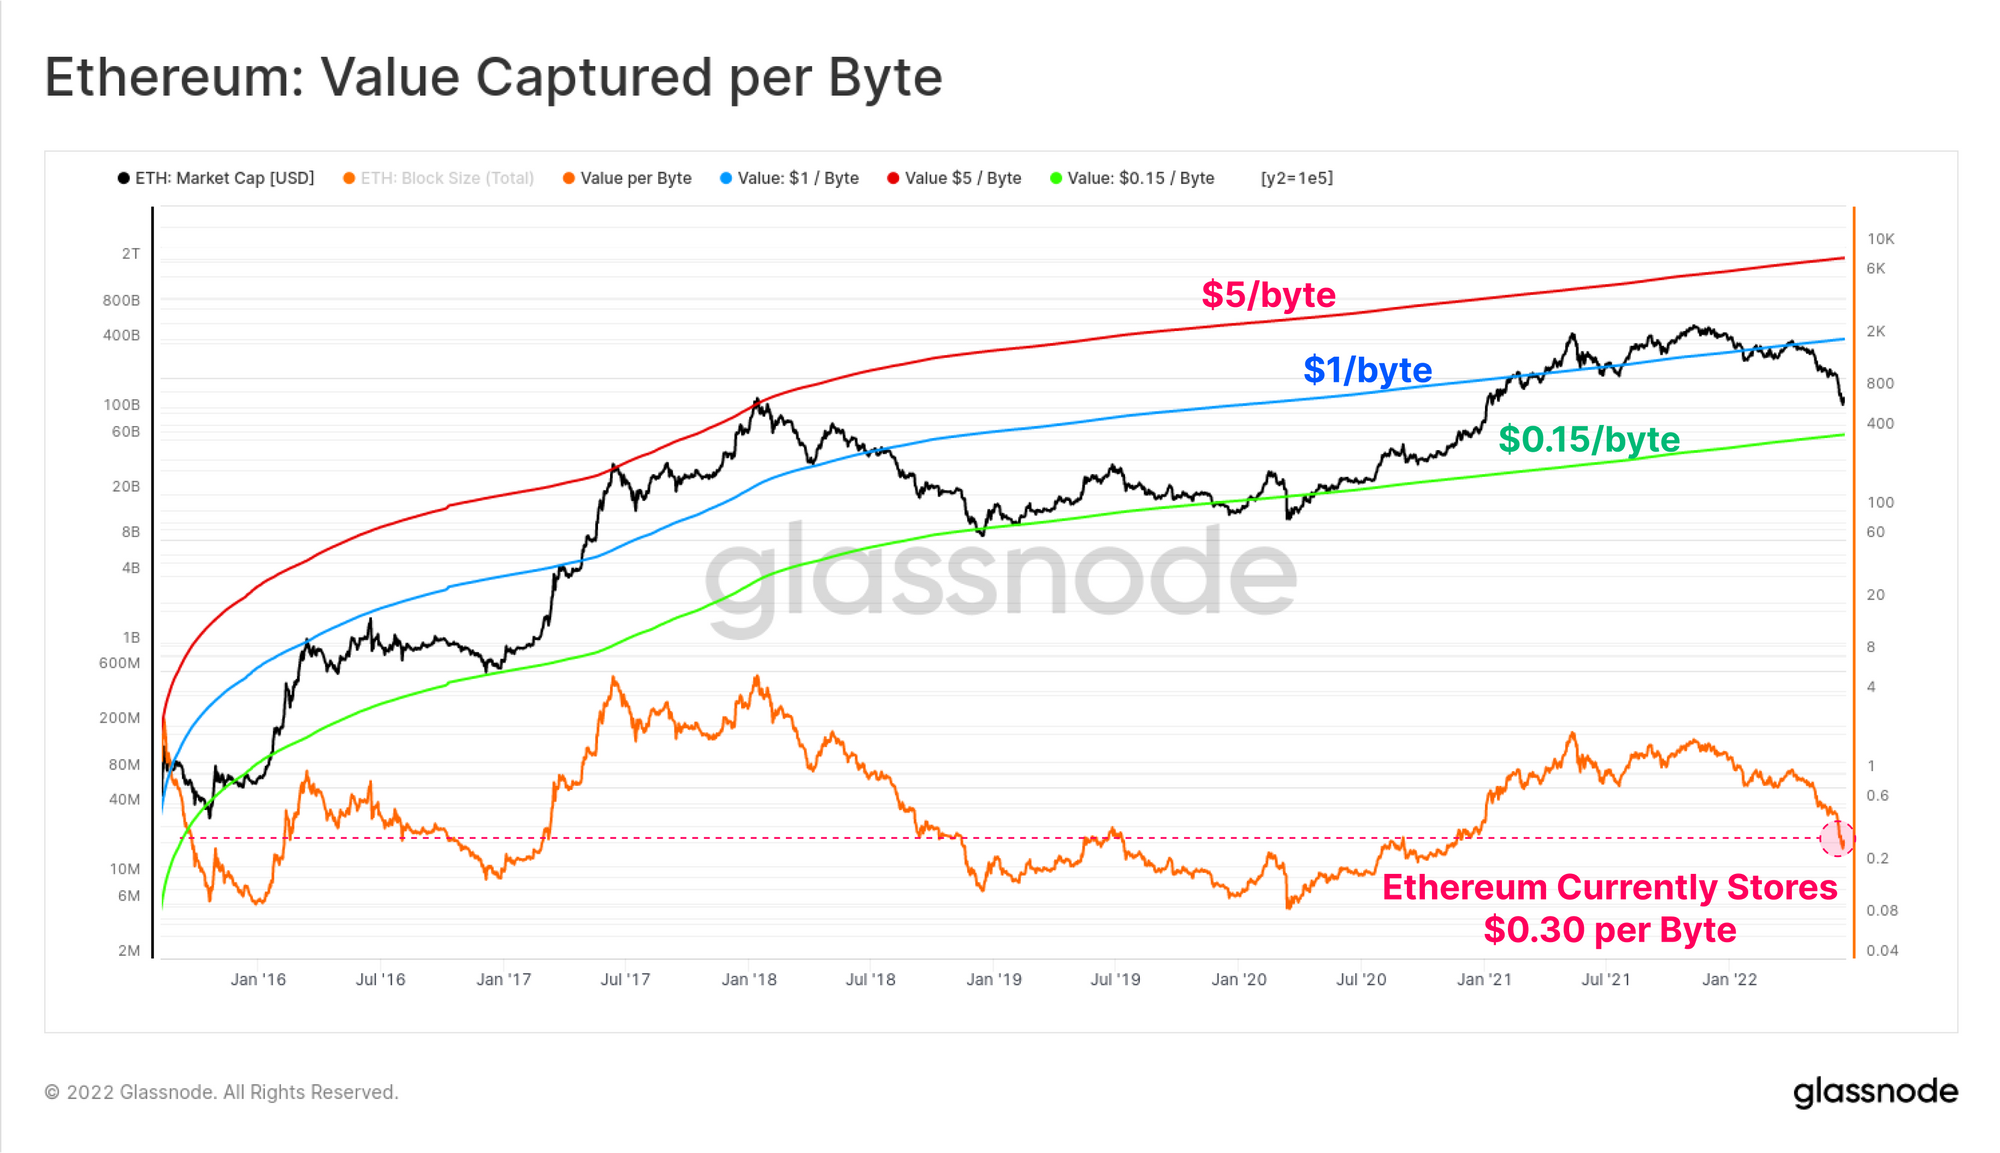
Looks like the value of the indicator has declined in recent weeks | Source: Glassnode
In the above graph, the red, blue, and green lines denote $5 per byte, $1 per byte, and $0.15 per byte, respectively.
Historically, Ethereum has formed bear market bottoms around when the network has captured a value of $0.15 per byte.
Similarly, when the indicator has had a value of about $5 per byte, the crypto has topped out (however, not all tops occurred around this value).
Most recently, the value of the metric has sunk down and the ETH blockchain is now storing around $0.30 per byte.
Related Reading | How This Ethereum Lending Platform Was Attacked And Made A Deal With The Hacker
Clearly, the indicator is at the moment double the $0.15 bottom line that the coin seems to have historically followed.
This may suggest that Ethereum could still have room for up to 50% more decline before the bear bottom is finally in.
However, the Glassnode report notes that this is only assuming that there is no fundamental improvement in value capture by the network.
The Ethereum environment today is quite different from a few years back; NFTs, DeFi, and other modern infrastructure didn’t exist then.
So, because of these factors, its possible the baseline for value stored by the network is now higher, suggesting that a bottom could take place at a higher point than in the past.
ETH Price
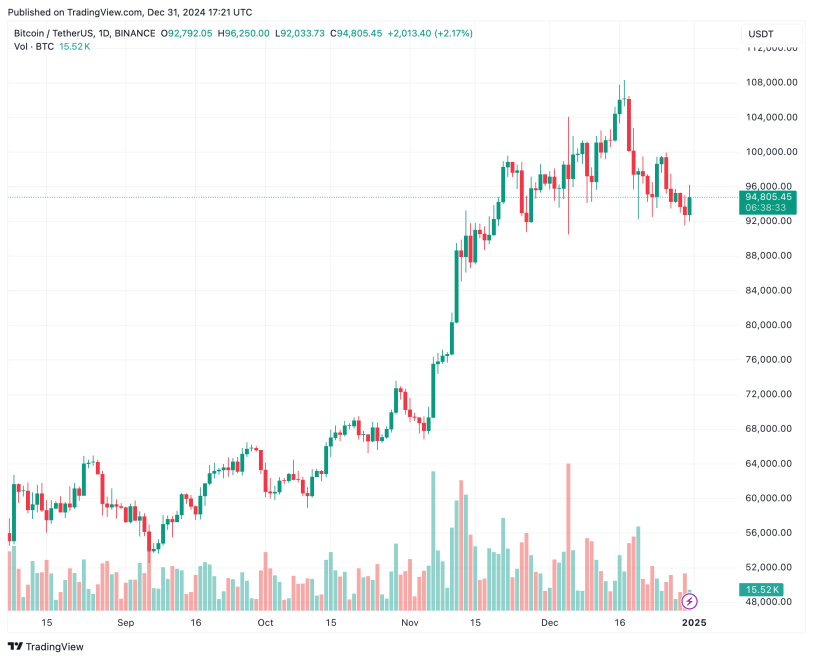
At the time of writing, Ethereum’s price floats around $1.1k, up 1% in the past week.

The price has mostly moved sideways over the last few days | Source: ETHUSD on TradingView
Featured image from Unsplash.com, charts from TradingView.com, Glassnode.com

You can get bonuses upto $100 FREE BONUS when you:
💰 Install these recommended apps:
💲 SocialGood - 100% Crypto Back on Everyday Shopping
💲 xPortal - The DeFi For The Next Billion
💲 CryptoTab Browser - Lightweight, fast, and ready to mine!
💰 Register on these recommended exchanges:
🟡 Binance🟡 Bitfinex🟡 Bitmart🟡 Bittrex🟡 Bitget
🟡 CoinEx🟡 Crypto.com🟡 Gate.io🟡 Huobi🟡 Kucoin.


Comments