On-chain data suggests the Bitcoin rally could continue further as the sector is still observing significant positive capital netflows.
Major Asset Classes In The Cryptocurrency Sector Continue To See Inflows
As pointed out by analyst Ali in a post on X, a large amount of capital is flowing into the cryptocurrency market right now. The Glassnode indicator that the analyst has cited tracks the netflows going into the sector by measuring two things.
First, it finds out the 30-day net position change in the “realized cap” of Bitcoin and Ethereum. The realized cap here refers to a capitalization model that calculates the total valuation of an asset by assuming that the price at which each token was last moved on the chain is its true value.
Since a token’s movement could likely represent a change of hands, the price at which it was transacted was its buying price. Thus, the realized cap provides us with information about the amount of capital that the holders as a whole have used to buy the cryptocurrency.
The second thing that the market netflow indicator keeps track of is the supply change of the major USD stablecoins. Since these coins are pegged to the dollar, their supply is the same as their market cap, and since they remain relatively stable, their realized cap is also roughly the same.
The reason that these three asset classes have been chosen to track cryptocurrency market capital netflows is that a vast majority of such transitions happen through them. Historically, the altcoins have only been fed their capital after a forward rotation from these major assets.
Now, here is a chart that shows how the sector has looked in terms of capital netflows over the year 2023:
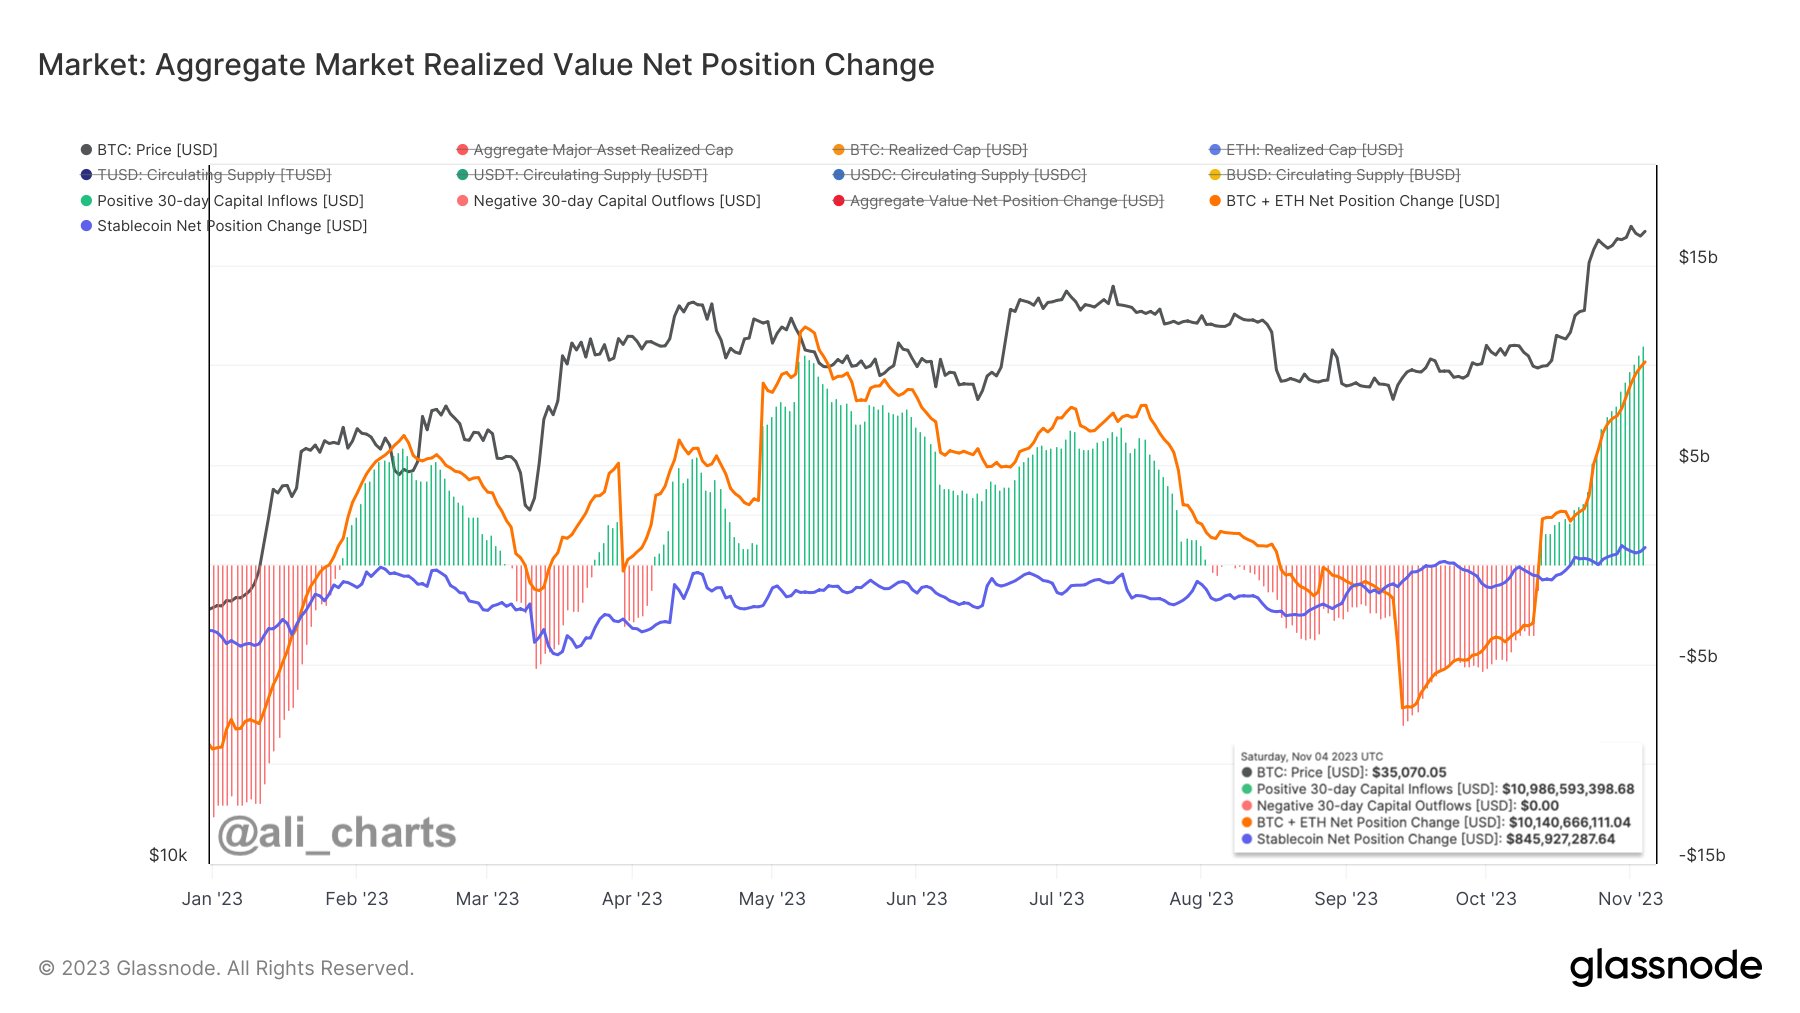
As displayed in the graph, the indicator’s value had been negative during the slump Bitcoin had observed a while ago, implying that capital was rapidly leaving the sector.
Last month, however, the metric finally turned positive and what followed was BTC’s impressive run towards the $35,000 level. The rest of the sector also walked in the lead of the original cryptocurrency, as the altcoins saw surges of their own.
In the chart, the net position change for the realized cap of Bitcoin and Ethereum, and that for the supply of the stablecoins are also separately shown. From it, it’s visible that the capital inflows this time have mostly come through BTC and ETH, as the stables have seen relatively tame growth.
So far, the inflows into the sector haven’t hit a phase of slowdown, as the indicator has only become more positive and has just set a new 2023 high of $10.97 billion.
This is naturally a positive sign for the Bitcoin rally, as such continued interest from the investors in the sector means the surge could potentially remain sufficiently fueled.
Bitcoin Price
Bitcoin has slowed down recently as its price is still continuing to consolidate around the $35,000 level. If the market inflows are anything to go by, though, the rally could possibly restart in the near future.

You can get bonuses upto $100 FREE BONUS when you:
💰 Install these recommended apps:
💲 SocialGood - 100% Crypto Back on Everyday Shopping
💲 xPortal - The DeFi For The Next Billion
💲 CryptoTab Browser - Lightweight, fast, and ready to mine!
💰 Register on these recommended exchanges:
🟡 Binance🟡 Bitfinex🟡 Bitmart🟡 Bittrex🟡 Bitget
🟡 CoinEx🟡 Crypto.com🟡 Gate.io🟡 Huobi🟡 Kucoin.


Comments