Data shows XRP and Solana have seen their Realized Volatility spike up after the sharp price action. Here’s how Bitcoin and other coins compare.
Assets Across Crypto Have Seen An Increase In 60-Day Realized Volatility
In a new post on X, the analytics firm Kaiko has shared how the 60-day Realized Volatility has changed recently for the various top coins in the cryptocurrency sector.
The “Realized Volatility” here refers to an indicator that basically tells us about how much an asset’s price has fluctuated during a given window of time. In the context of the current topic, the period of relevance is the 60-day one.
Here is the chart shared by the analytics firm, that shows the trend in the Realized Volatility for five top digital assets: Bitcoin (BTC), XRP (XRP), Solana (SOL), Dogecoin (DOGE), and Cardano (ADA).
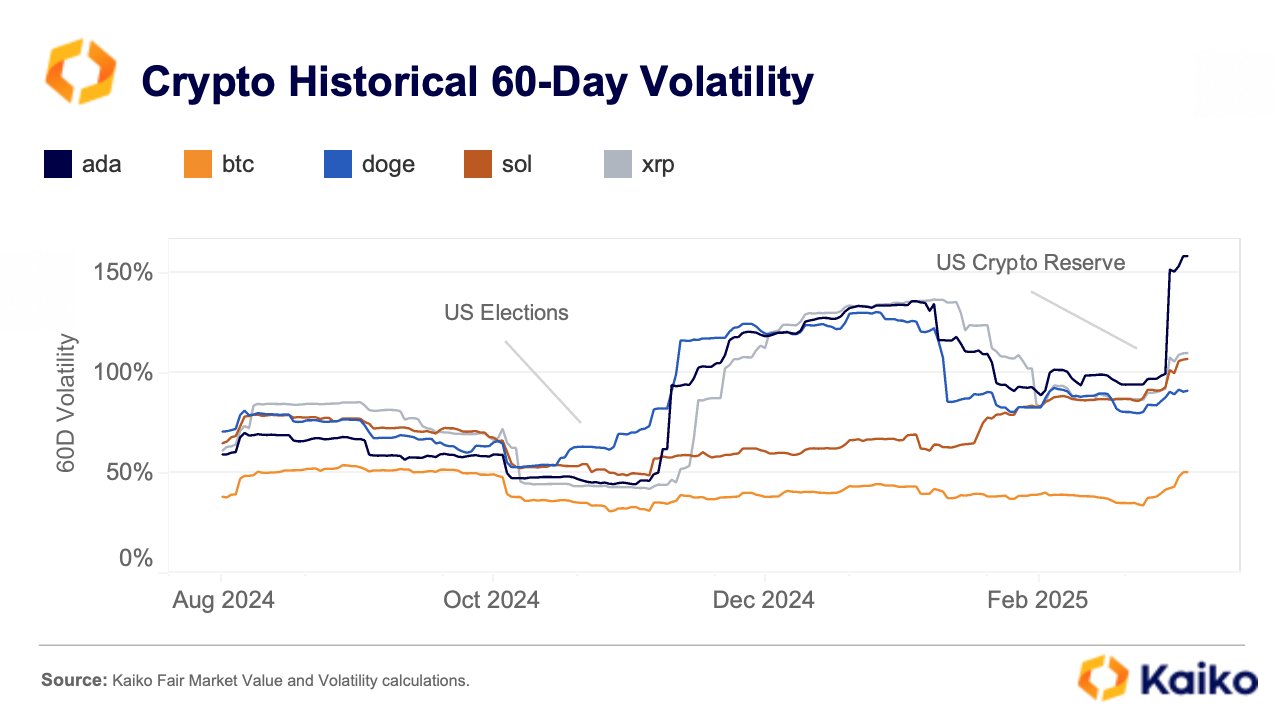
As displayed in the above graph, the 60-day Realized Volatility has seen an increase for each of these assets recently. This is naturally a result of all the volatile price action that the different assets have gone through, especially since the US Crypto Reserve announcement from President Donald Trump.
XRP and SOL, two of the assets initially confirmed for the Reserve, have both seen the metric spike to a similar value above 100%. The third altcoin from the announcement, ADA, has seen its volatility break away from the rest, as the indicator has reached a new all-time high (ATH) of about 150% for it.
The memecoin DOGE has seen the smallest increase out of these assets, although its 60-day Realized Volatility is still at an appreciable level. The coin that stands out for having a relatively low value of the indicator is BTC, the original cryptocurrency.
Even though Bitcoin has seen a notable jump in the metric, its value still remains at around just 50%. Thus, it would appear that XRP and others have seen significantly sharper price action than BTC in the last 60 days.
In some other news, the recent market volatility has meant that fear has exploded among the cryptocurrency traders, as the analytics firm Santiment has explained in an X post.

In the chart, the data of an indicator called the Social Volume is displayed. This metric counts up the number of posts/threads/messages that are making unique mentions of a given topic or term.
From the graph, it’s visible that the Social Volume related to low Bitcoin price levels ($50,000 to $69,000) has spiked recently, meaning that the investors are predicting a bearish outcome for the asset.
Historically, a high amount of fear surrounding the number one digital asset has actually been a bullish sign for not just its price, but also the altcoins like XRP and Solana.
At present, the bullish Social Volume ($100,000 to $119,000) is still at a high level, so while fear is rising, optimism hasn’t disappeared yet. As Santiment notes,
The true capitulation point (and optimal buy spot) will be when low prices ($50K-$69K) are being predicted across social media with very little mention of high prices ($100K-$119K).
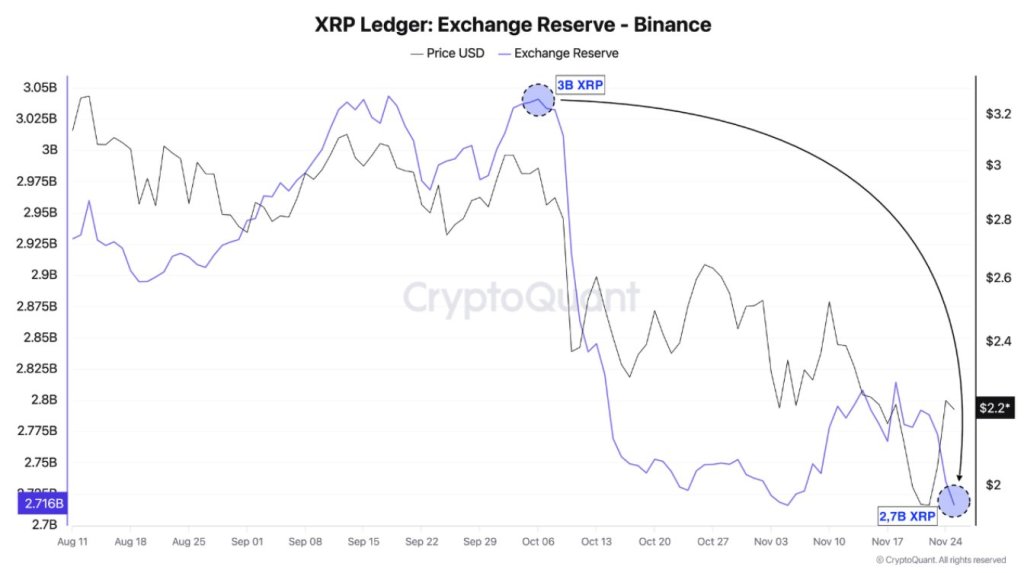
XRP Price
At the time of writing, XRP is floating around $2.1, down more than 14% over the last seven days.

You can get bonuses upto $100 FREE BONUS when you:
💰 Install these recommended apps:
💲 SocialGood - 100% Crypto Back on Everyday Shopping
💲 xPortal - The DeFi For The Next Billion
💲 CryptoTab Browser - Lightweight, fast, and ready to mine!
💰 Register on these recommended exchanges:
🟡 Binance🟡 Bitfinex🟡 Bitmart🟡 Bittrex🟡 Bitget
🟡 CoinEx🟡 Crypto.com🟡 Gate.io🟡 Huobi🟡 Kucoin.


Comments