
While bulls remain in control above $38k, BTC price could dip to $36k if bears succeed in breaching a key support level on the daily chart
Bitcoin (BTC) is up 3.6% in the past 24 hours as bulls battle selling pressure amid optimism that the benchmark cryptocurrency could yet again break the $40,000 barrier and seek last week's highs of $42,629.
Yesterday, Bitcoin price jumped 4% after positive comments from US Securities and Exchange Commission chair Gary Gensler about BTC. Speaking to CNBC, Gensler said that he is "pro innovation"& and that he supports favourable crypto regulations designed to help the industry grow.
As of writing, Bitcoin's price is hovering around $39, 405, with cumulative intraweek losses of 2.2%. The BTC/USD pair has a 24-hour range of $37,703 to $39,979, suggesting that bears are not taking bulls' advances lightly as seen during early Thursday action.
According to pseudonymous crypto analyst Rekt Capital, Bitcoin needs to break $40,000 to see further growth, although a pullback to lows of $36,000 or lower is still possible.
If this recent #BTC bounce is merely a relief rally to flip the 200-day EMA back into resistance…
Then $BTC could pullback towards the blue 50-day EMA
The 50 DEMA is another EMA that has historically proven to be useful in supporting Bull Market uptrends#Crypto #Bitcoin pic.twitter.com/AWwP5jomvv
— Rekt Capital (@rektcapital) August 4, 2021
Bitcoin price outlook
On the weekly chart, BTC/USD leans slightly bullish with price above the 50MA and the RSI in the neutral zone while the MACD suggests a possible bullish flip. Also, the price high of the current candlestick is above the previous close, meaning bulls have the advantage if price stays above support at around $38,409.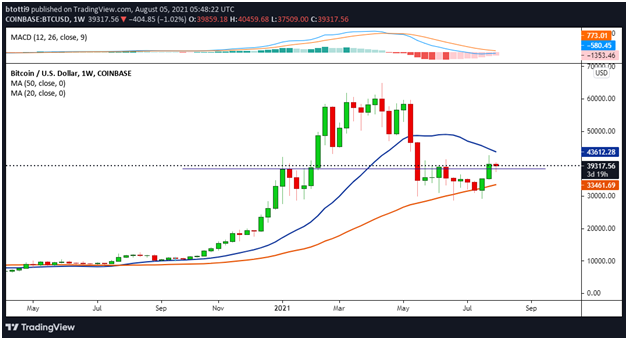
BTC/USD weekly chart. Source: TradingView
The bearish picture might, however, intensify if prices continue lower over the next three days, with a declining 20MA indicative of bearish pressure. The prognosis, therefore, suggests another upside will see bulls target the $43,600 resistance zone. On the downside, the main support is near $33,450.
The daily chart looks more promising despite yet another rejection around the $40,000 level. The downturn followed the appearance of a Doji candle with the high price settling at the previous candle's close on 29 July.
BTC/USD moved higher as indecision appeared to resolve in the bulls' favour, but the next four candles worked out the correction to form highs of $42,496 before a textbook bounce off the 38.2% Fibonacci retracement level at $37,532.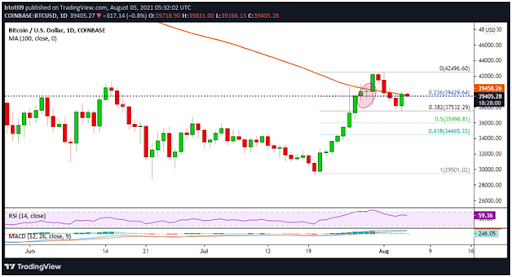
BTC/USD daily chart. Source: TradingView
However, bulls are currently battling downward pressure near the 23.6% Fibonacci retracement level at $39,430. If fresh price dips occur, the crucial 38.2% Fib level offers the immediate anchor.
Other support levels are likely to be found at the 50% and 61.8% Fibonacci retracement levels around $35,999 and $34,465 respectively.
The post Bitcoin price analysis: BTC sees fresh dips below $39k appeared first on Coin Journal.

You can get bonuses upto $100 FREE BONUS when you:
💰 Install these recommended apps:
💲 SocialGood - 100% Crypto Back on Everyday Shopping
💲 xPortal - The DeFi For The Next Billion
💲 CryptoTab Browser - Lightweight, fast, and ready to mine!
💰 Register on these recommended exchanges:
🟡 Binance🟡 Bitfinex🟡 Bitmart🟡 Bittrex🟡 Bitget
🟡 CoinEx🟡 Crypto.com🟡 Gate.io🟡 Huobi🟡 Kucoin.


Comments