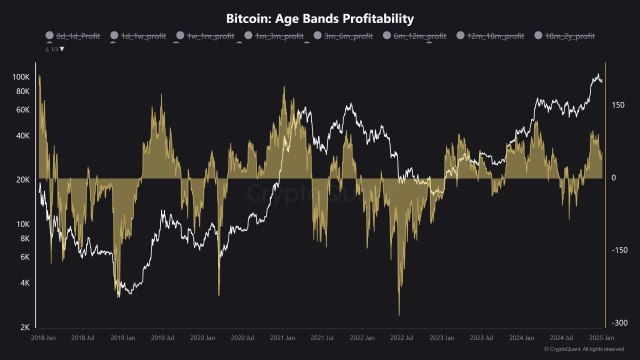
 | Of all the technical analysis, on-chain metrics and statistics, these two graphs are - in my opinion - the most important: Number of people currently holding 0.1-1.0 BTC (2010-2021) Number of people currently holding 0.1-1.0 BTC (Zoomed: 2020-2021) The vast majority of people in this group are DCAers - i.e. people like us - buying daily/weekly/monthly. Now for the incredible part: this data is not price-adjusted. That's right. The rate is either increasing or near-constant regardless of price. That's a phenomenon known as inelastic demand:
A 10-year long inelastic demand - for an asset with a 100x move and several 80%+ corrections. That is virtually unheard of outside of core essentials. What's more, once a person acquires 1.0+ BTC, they're no longer present on this chart - and are replaced by new DCAers*. \Sales are not accounted for.) The comparison to food, gasoline etc. is not perfect - since these are perishables, while most of us hold BTC rather than spending it. Nevertheless, it's still an amazing observation. Holders of 0.1-1.0 BTC are the fastest-growing cohort: Headcount continues to increase undeterred, at a rapid pace. It's estimated that this group will control ~$100b of liquid capital within the next 2y. What does all of this mean? (1) Companies cannot afford to ignore BTC/crypto for much longer. The vast majority of their customers are not whales - but people like us. (2) BTC, IMO, is on course to bridge the chasm: Making it an inevitability that cannot be stopped. Credit to @ PiPrimePi and @ WClementell for this awesome perspective. [link] [comments] |

You can get bonuses upto $100 FREE BONUS when you:
💰 Install these recommended apps:
💲 SocialGood - 100% Crypto Back on Everyday Shopping
💲 xPortal - The DeFi For The Next Billion
💲 CryptoTab Browser - Lightweight, fast, and ready to mine!
💰 Register on these recommended exchanges:
🟡 Binance🟡 Bitfinex🟡 Bitmart🟡 Bittrex🟡 Bitget
🟡 CoinEx🟡 Crypto.com🟡 Gate.io🟡 Huobi🟡 Kucoin.








Comments