Ethereum price got rejected from $2,000 despite showing strong bullish signs against Tether (USDT) ahead of “The Merge.” The price of Ethereum has struggled to regain its bullish momentum as this has created a mixed feeling between Ethereum bulls and bears. (Data from Binance)
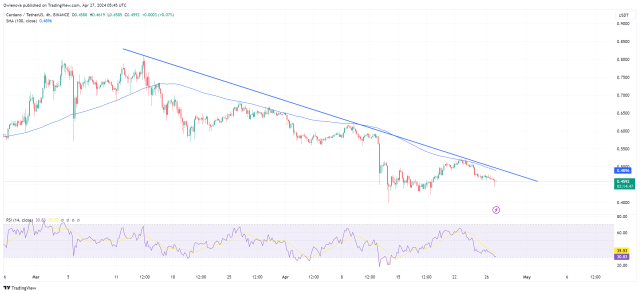
Price Analysis Of ETH On The Four-Hourly (4H) Chart Four Hourly ETH Price Chart Analysis | Source: ETHUSDT On Tradingview.comThe price of ETH on the 4H chart has continued to look bullish, trying to hold above the support area at $1,500. ETH price trades below the 50 EMA on the 4H chart, with more buy orders in this region.
After forming a bullish divergence on the 4H chart as the price was oversold, the ETH price rallied to $1,600, trying to break above the 50 EMA, acting as resistance for the ETH price.
The 50 EMA price corresponds to the resistance at $1,620.
The Relative Strength Index (RSI) for ETH on the 4H chart is above 45, indicating moderate buy volume for ETH price.
Four-Hourly (4H) resistance for ETH price – $1,620.
Four-Hourly (4H) support for ETH price – $1,500.
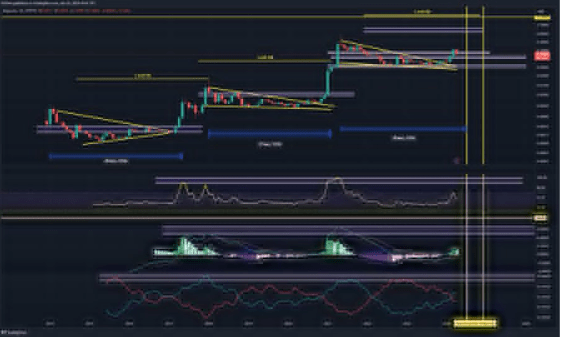
Price Analysis Of ETH On The Weekly (1W) Chart Weekly ETH Price Chart Analysis | Source: ETHUSDT On Tradingview.comThe price of ETH found its weekly low at $1,000 and quickly bounced off the area where it has formed good support; ETH price rallied to a region of $2,030 as the price was rejected, preventing ETH price from trending higher.
Despite showing great bullish signs, ETH is trading at $1,540 below the 50 and 200 Exponential Moving Averages (EMA), acting as resistance for the price of ETH to break higher.
The 50 and 200 EMA correspond to prices of $2,200 and $1,580, respectively; for ETH to trend higher, it must break through this region, which acts as resistance for ETH prices.
A break and close above the 50-day moving average would indicate a short-term relief bounce and the possibility of price trending to $3,500
Weekly (1W) resistance for ETH price – $1,580, $2,200.
Weekly (1W) support for ETH price – $988.
Ethereum (ETH) Price Analysis On The Monthly ChartThe price of ETH saw a bullish price movement in the previous month, closing with so many bullish sentiments, with talks focused on a rally to its all-time high of $4,000.
With previous month’s candle closed bullish but was soon followed by a bearish candle which saw the price of ETH showing bullish signs short-lived.
As the price of ETH comes to a monthly close, ETH needs to close at $1,700 to have a better chance of trending higher, with many hoping ETH prices outperform the market in the coming days.
Monthly resistance for the price of ETH – $2,200.
Weekly support for the price of ETH – $988.
Featured Image From Coinpedia, Charts From TradingView.com
You can get bonuses upto $100 FREE BONUS when you:
💰 Install these recommended apps:
💲 SocialGood - 100% Crypto Back on Everyday Shopping
💲 xPortal - The DeFi For The Next Billion
💲 CryptoTab Browser - Lightweight, fast, and ready to mine!
💰 Register on these recommended exchanges:
🟡 Binance🟡 Bitfinex🟡 Bitmart🟡 Bittrex🟡 Bitget
🟡 CoinEx🟡 Crypto.com🟡 Gate.io🟡 Huobi🟡 Kucoin.


Comments