Bitcoin price failed to clear the $37,000 resistance against the US Dollar. BTC is declining and it remains at a risk of more losses below $34,000.
- Bitcoin is facing a lot of hurdles near the $36,000 and $37,000 resistance levels.
- The price is currently trading well below $37,000 and the 100 hourly simple moving average.
- There is a key bearish trend line forming with resistance near $36,000 on the hourly chart of the BTC/USD pair (data feed from Kraken).
- The pair could decline heavily if it settles below the $34,000 support and $33,200.
Bitcoin Price Turns Red
Bitcoin made a couple of attempts to clear the $37,000 resistance zone, but it failed. The last swing low was formed near $33,650 before BTC corrected higher.
It broke the $34,000 and $35,000 resistance levels. There was also a break above the 23.6% Fib retracement level of the downward move from the $40,417 high to $33,650 low. The price is now struggling to clear the $36,000 resistance level.
Bitcoin is also trading well below $37,000 and the 100 hourly simple moving average. Moreover, there is a key bearish trend line forming with resistance near $36,000 on the hourly chart of the BTC/USD pair.
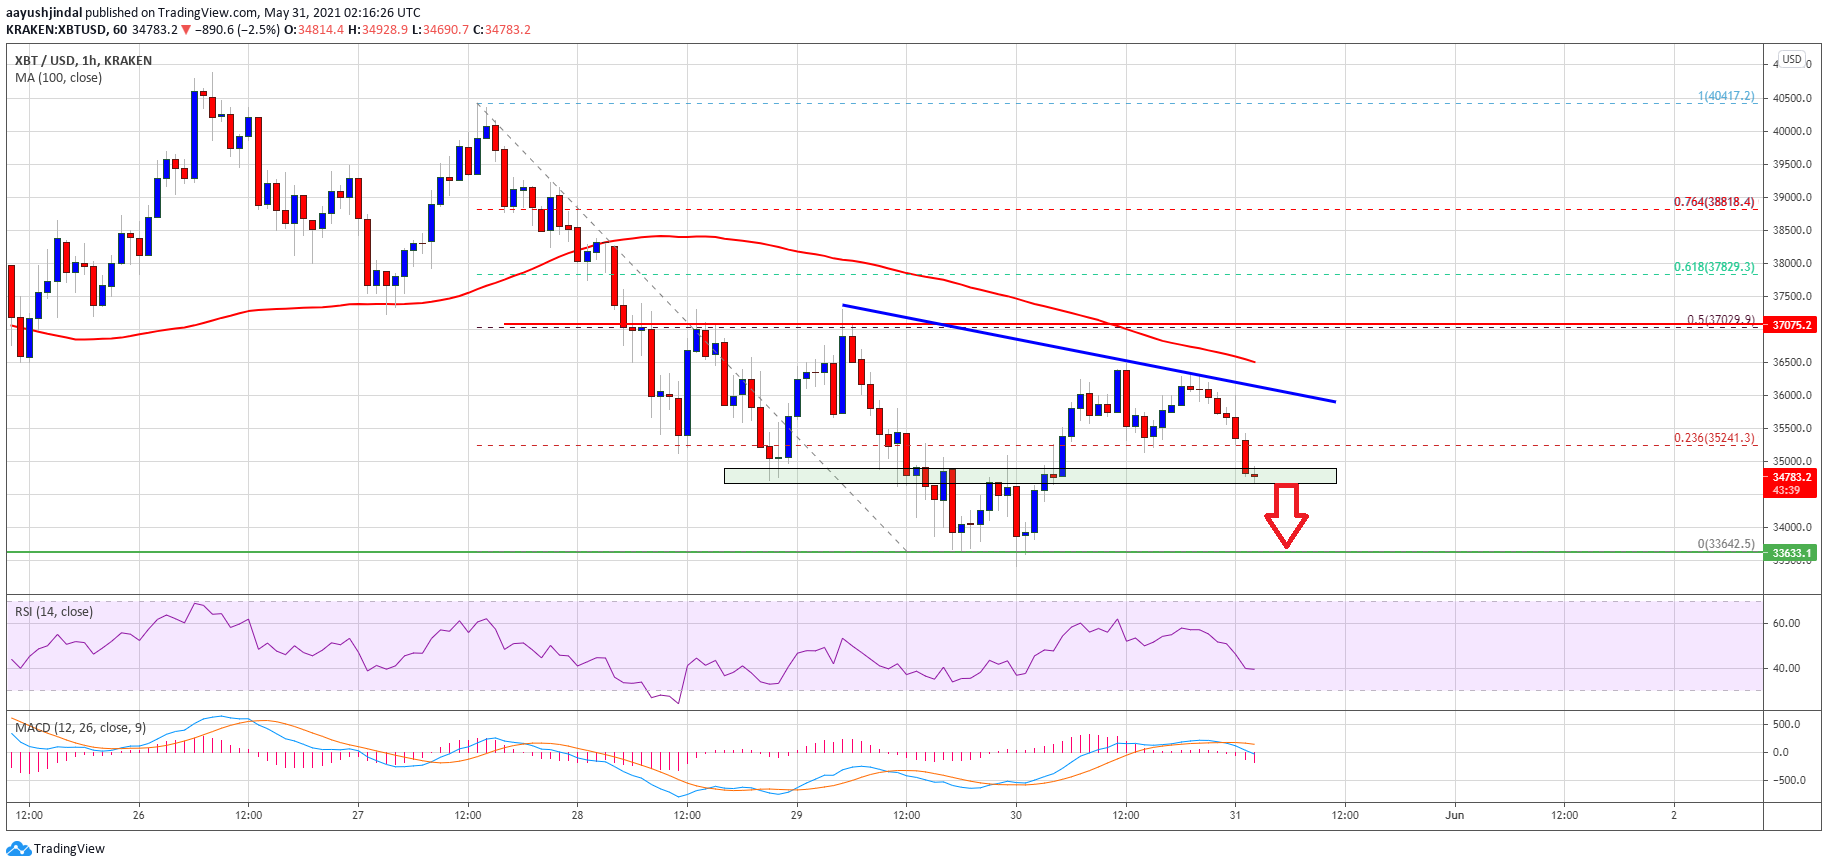
Source: BTCUSD on TradingView.com
On the upside, an immediate resistance is near the $35,500 level. The first major resistance is near the $36,000 level and the trend line. The next major resistance is near the $37,000 level. It is close to the 50% Fib retracement level of the downward move from the $40,417 high to $33,650 low.
A close above the $37,000 resistance zone could open the doors for a steady increase. The next major barrier for the bulls is near $40,000 level.
More Losses in BTC?
If bitcoin fails to clear the $36,000 resistance, there is a risk of a downside break. An initial support on the downside is near the $34,500 level.
The first major support is near the $34,000 level. If there is a downside break below the $34,000 support, the price could decline towards the $32,000 support zone in the coming sessions. Any more losses could clear the path for a test of the $30,000 level.
Technical indicators:
Hourly MACD &- The MACD is slowly gaining pace in the bearish zone.
Hourly RSI (Relative Strength Index) &- The RSI for BTC/USD is now below the 50 level.
Major Support Levels &- $34,000, followed by $32,000.
Major Resistance Levels &- $35,500, $36,000 and $37,000.

You can get bonuses upto $100 FREE BONUS when you:
💰 Install these recommended apps:
💲 SocialGood - 100% Crypto Back on Everyday Shopping
💲 xPortal - The DeFi For The Next Billion
💲 CryptoTab Browser - Lightweight, fast, and ready to mine!
💰 Register on these recommended exchanges:
🟡 Binance🟡 Bitfinex🟡 Bitmart🟡 Bittrex🟡 Bitget
🟡 CoinEx🟡 Crypto.com🟡 Gate.io🟡 Huobi🟡 Kucoin.


Comments