Bitcoin is attempting an upside correction above $57,000 against the US Dollar. BTC could gain pace if there is a close above the $58,000 resistance.
- Bitcoin is facing resistance near the $58,000 and $58,500 levels.
- The price is now trading near $57,500 and the 100 hourly simple moving average.
- There was a break above a major bearish trend line with resistance near $57,100 on the hourly chart of the BTC/USD pair (data feed from Kraken).
- The pair must settle above $58,000 to start a fresh increase in the near term.
Bitcoin price remained in a range above the $55,500 support zone. BTC formed a base above the $55,500 level and is currently attempting a decent recovery wave.
There was a break above the $56,500 and $57,000 resistance levels. Besides, there was a break above a major bearish trend line with resistance near $57,100 on the hourly chart of the BTC/USD pair. The pair even spiked above the $57,500 level and the 100 hourly simple moving average.
However, the price is still struggling to gain pace above the $58,000 level. A high is formed near $58,222 and the price is now consolidating gains.
The bears pushed the price below the 23.6% Fib retracement level of the upward move from the $55,909 swing low to $58,222 high. An immediate support is near the $57,500 level. The first major support is now forming near the $57,000 level.
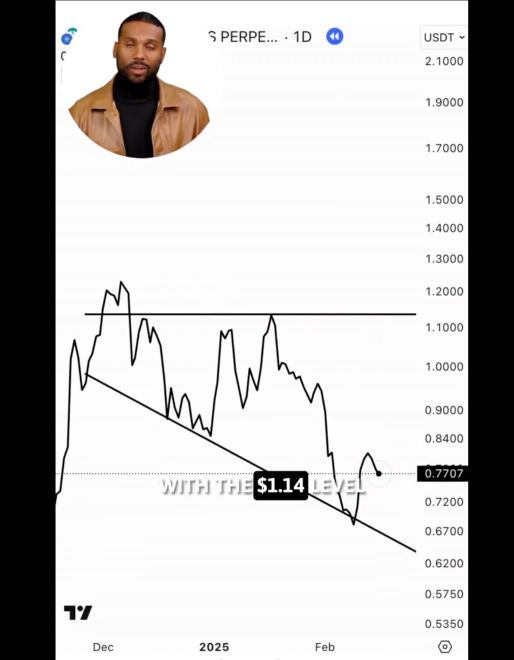
Source: BTCUSD on TradingView.comThe 50% Fib retracement level of the upward move from the $55,909 swing low to $58,222 high is also near $57,000. The next major support is near the $56,500 level, below which the price could resume its decline towards the main breakdown support at $55,500.
Upside Capped In BTC?If bitcoin stays above the $56,500 support, it could continue to rise. On the upside, an initial resistance is near the $58,000 level.
The next key resistance is near the $58,500 level. A close above the $58,000 and $58,500 levels may possibly start a steady increase in the near term. The next major resistance sits near the $60,000 level.
Technical indicators:
Hourly MACD – The MACD is now losing pace in the bearish zone.
Hourly RSI (Relative Strength Index) – The RSI for BTC/USD is well above the 50 level.
Major Support Levels – $56,500, followed by $56,000.
Major Resistance Levels – $58,000, $58,500 and $60,000.

You can get bonuses upto $100 FREE BONUS when you:
💰 Install these recommended apps:
💲 SocialGood - 100% Crypto Back on Everyday Shopping
💲 xPortal - The DeFi For The Next Billion
💲 CryptoTab Browser - Lightweight, fast, and ready to mine!
💰 Register on these recommended exchanges:
🟡 Binance🟡 Bitfinex🟡 Bitmart🟡 Bittrex🟡 Bitget
🟡 CoinEx🟡 Crypto.com🟡 Gate.io🟡 Huobi🟡 Kucoin.


Comments