Ethereum extended its rise and traded close to $2,900 against the US Dollar. ETH price is correcting gains and it is likely to remain strong above the 100 hourly SMA
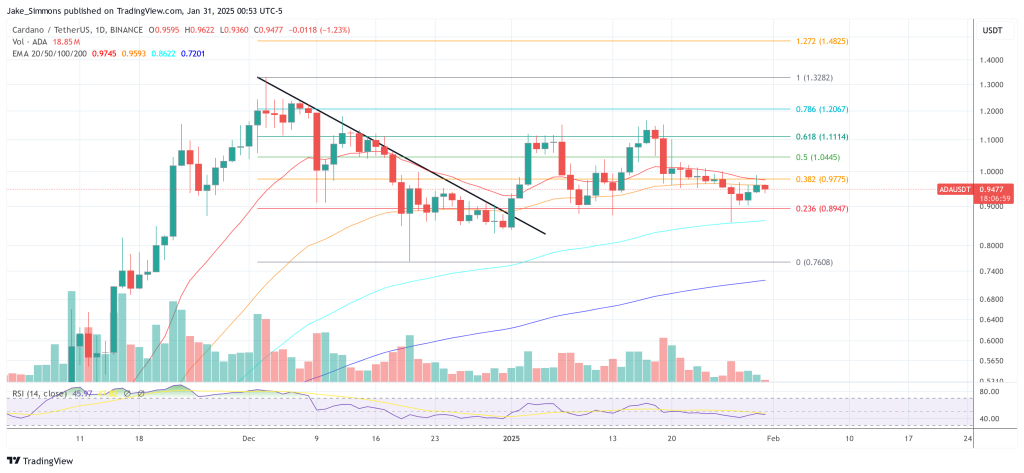
- Ethereum failed to clear the $2,900 level and it corrected lower from $2,885.
- The price is still holding the $2,700 support and the 100 hourly simple moving average.
- There was a break below a short-term bullish trend line with support near $2,750 on the hourly chart of ETH/USD (data feed via Kraken).
- The pair could start a strong increase as long as there is no break below the 100 hourly SMA and $2,650.
Ethereum Price Is Holding Support
Yesterday, ethereum started a fresh increase above the $2,650 resistance zone. ETH gained pace above the $2,700 and $2,750 levels. There was also a break above the $2,800 level and the 100 hourly simple moving average.
However, the price failed to continue higher above $2,900. A high was formed near $2,886 and the price recently started a fresh decline. There was a break below the $2,800 support zone. Ether price even traded below the 23.6% Fib retracement level of the upward move from the $2,530 swing low to $2,996 high.
There was a break below a short-term bullish trend line with support near $2,750 on the hourly chart of ETH/USD. The pair is now testing the 50% Fib retracement level of the upward move from the $2,530 swing low to $2,996 high.
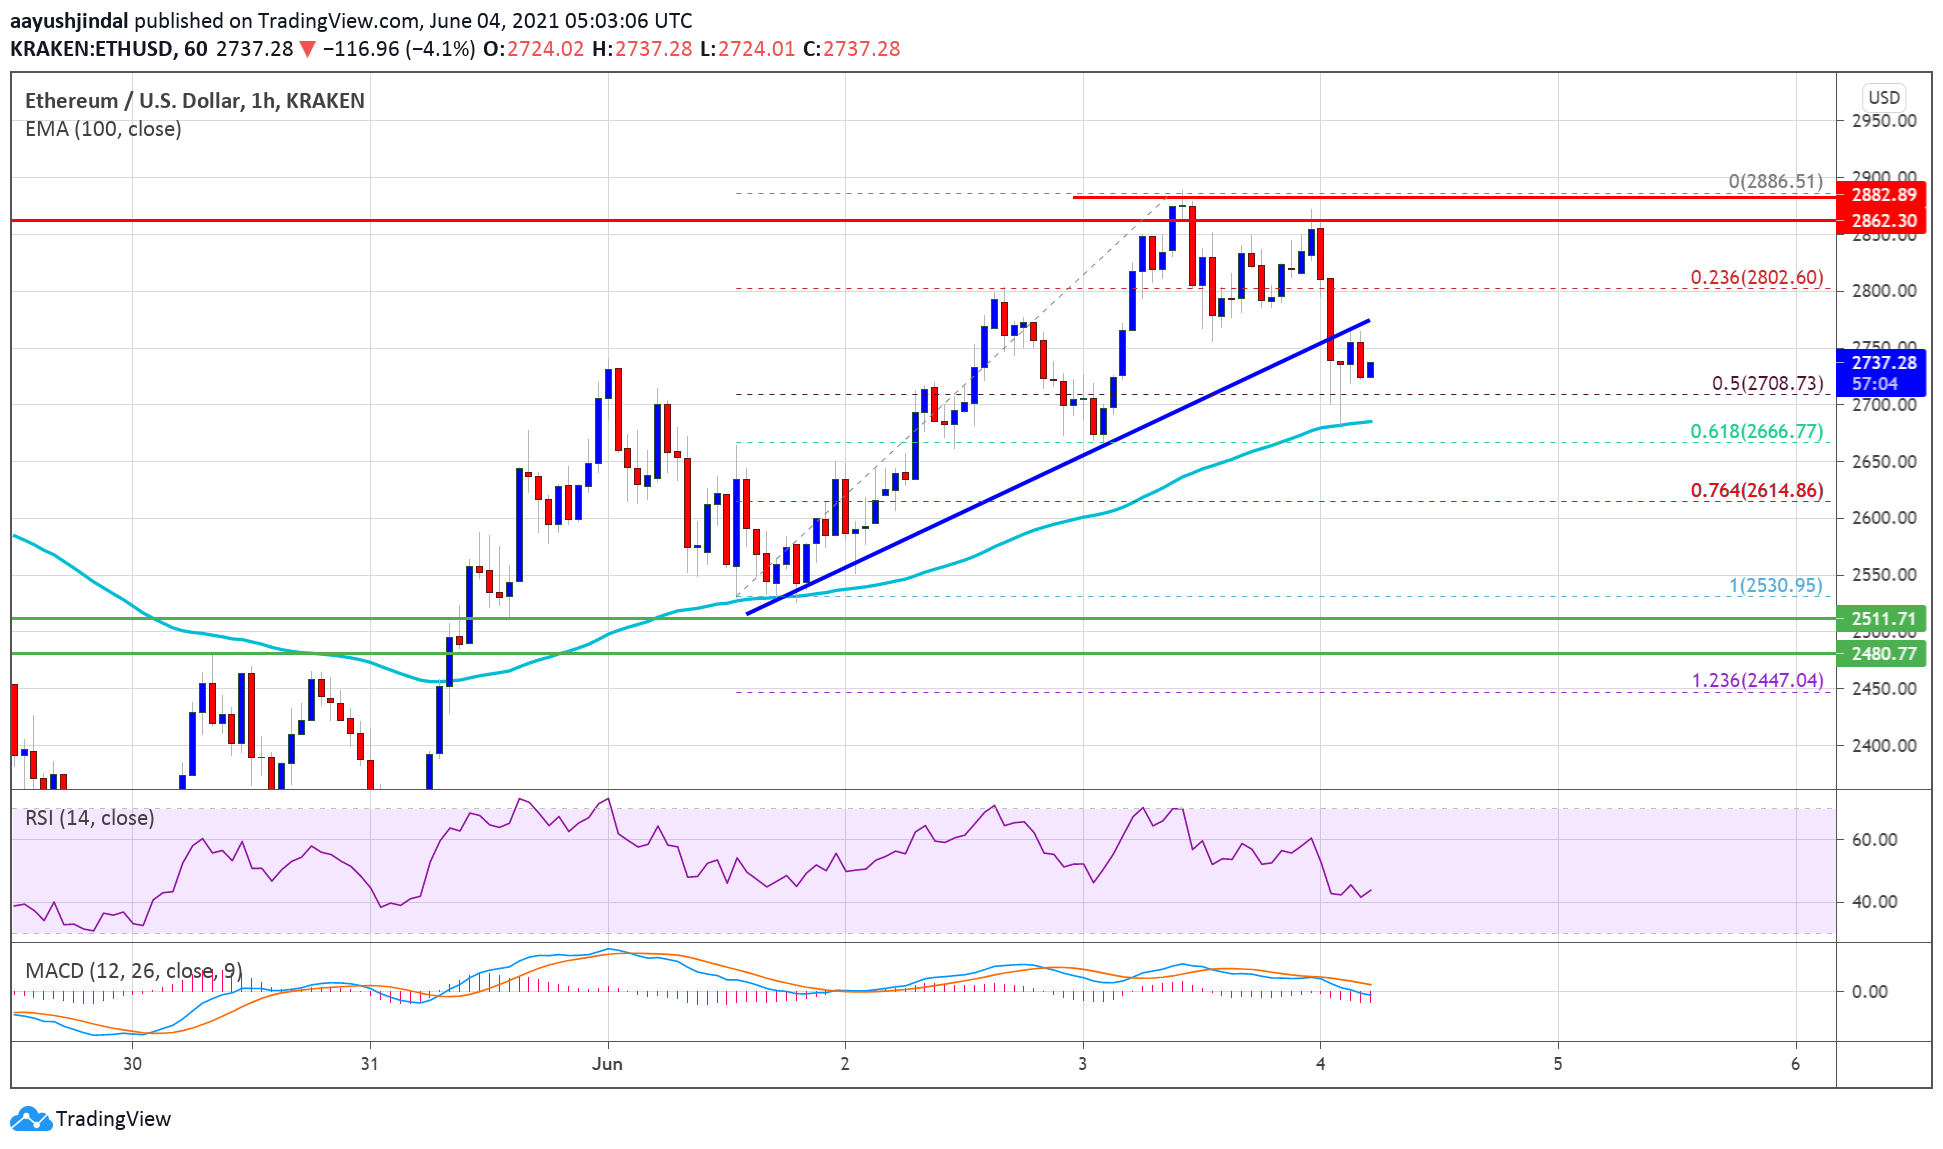
Source: ETHUSD on TradingView.com
It is also holding the $2,700 support and the 100 hourly simple moving average. An initial resistance on the upside is near the $2,780 and $2,800 levels. The first major resistance is near the $2,850 level.
The main breakout resistance is now forming near the $2,900 level. A close above the $2,900 level will most likely call for a test of the $3,000 barrier in the near term.
Dips Supported in ETH?
If Ethereum fails to clear the $2,800 and $2,850 resistance levels, it could extend its decline. An initial support on the downside is near the $2,700 level.
The main support is now forming near the $2,680 level and the 100 hourly SMA. A downside break below $2,680 and $2,650 could open the doors for a larger decline. In the stated case, ether price might revisit USD 2,500.
Technical Indicators
Hourly MACD &- The MACD for ETH/USD is slowly losing pace in the bearish zone.
Hourly RSI &- The RSI for ETH/USD is currently below the 50 level.
Major Support Level &- $2,650
Major Resistance Level &- $2,850

You can get bonuses upto $100 FREE BONUS when you:
💰 Install these recommended apps:
💲 SocialGood - 100% Crypto Back on Everyday Shopping
💲 xPortal - The DeFi For The Next Billion
💲 CryptoTab Browser - Lightweight, fast, and ready to mine!
💰 Register on these recommended exchanges:
🟡 Binance🟡 Bitfinex🟡 Bitmart🟡 Bittrex🟡 Bitget
🟡 CoinEx🟡 Crypto.com🟡 Gate.io🟡 Huobi🟡 Kucoin.


Comments