XRP and other market movers have continued to face the wrath of the bears. The altcoin has fallen considerably over the last 24 hours. It had secured gains over the past week but since the bulls are back, the coin lost what it had gained.
Profit booking has taken over as the market movers witnessed a brief relief rally. Although price of the altcoin surged by 16% over a week, the daily losses have invalidated most of it. In the last 24 hours the coin fell by 3%, bringing its price down to $0.34.
The bulls have tired out and surrendered to the bears. Selling pressure has increased as XRP turned bearish. The next crucial resistance for the coin hovers at around the $0.30 mark. Technical outlook for XRP flashed mixed signals with a positive divergence on the daily chart.
XRP Price Analysis: One Day Chart
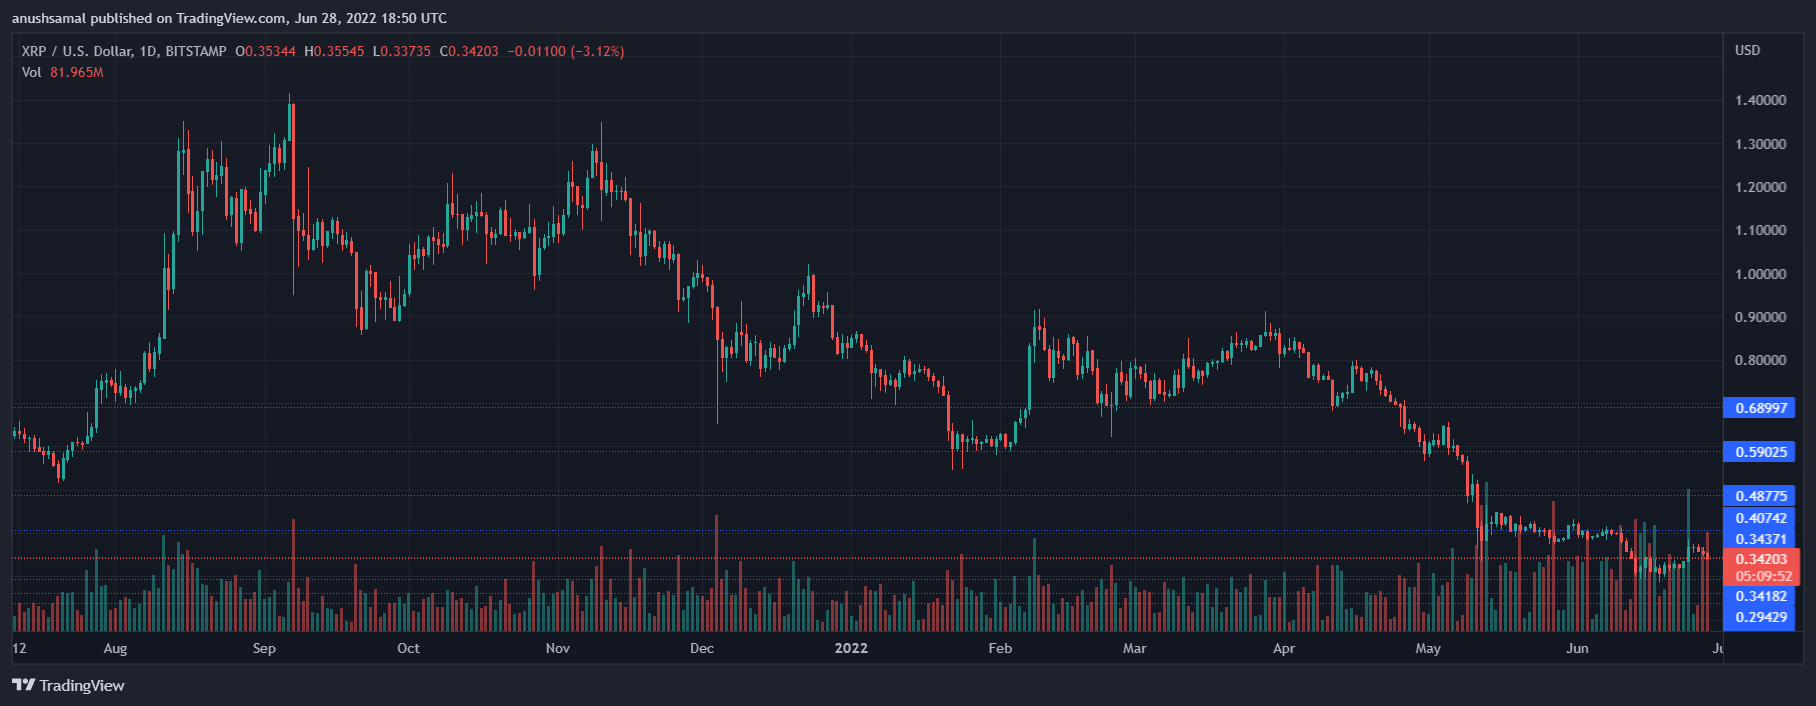
The altcoin was trading for $0.34 on the one day chart. Immediate resistance for the coin was at $0.48 Before XRP revisits the aforementioned price level of $0.48, the coin has to trade above the $0.40 mark for sometime. Going by the near term technical outlook, the altcoin could lose on its chart again.
The support region for the coin would be near $0.30 to $0.28 in a case of a further fall. The amount of XRP traded in the previous session has shot up signifying that sellers were active in the market, the bar was in red highlighting bearish strength.
Technical Analysis
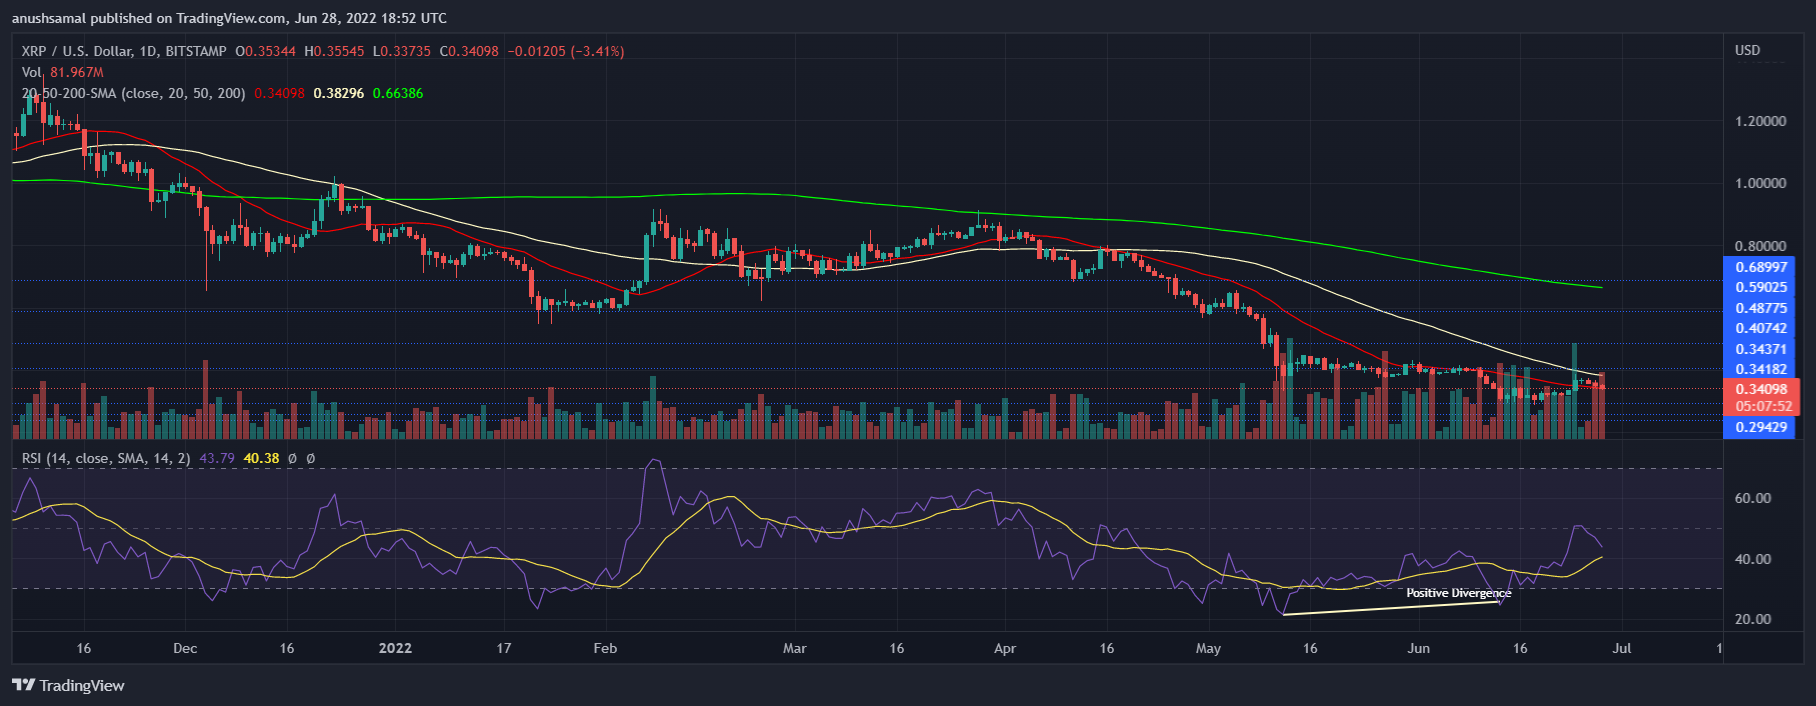
Indicators were bearish on the 24 hour chart. In accordance with profit booking, sellers had increased in number at the time of writing. The Relative Strength Index slipped below the half-line signifying bearishness as sellers took over the market.
On the 20-SMA line, price of XRP was parked below the 20-SMA line, this signalled that selling pressure mounted because sellers drove the price momentum in the market. The above chart however displayed a chance of price undergoing a correction. On the RSI, a positive divergence was formed. A positive divergence indicates that buying strength would return and help the price of the asset to move north on its chart.
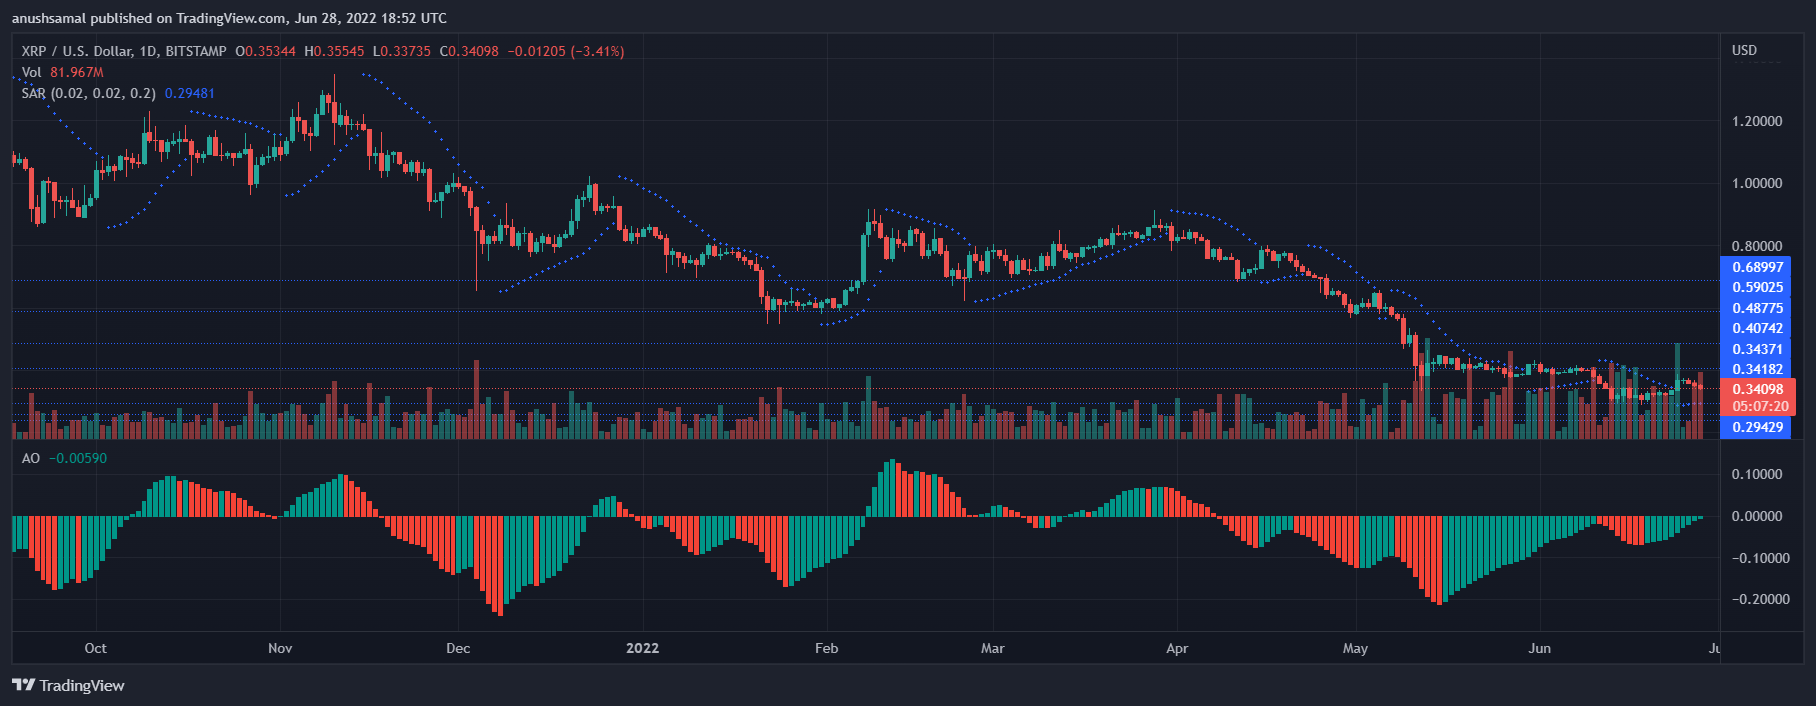
Sellers have re-entered the market, despite this observation, XRP has continued to flash buy signal in the market. This could mean that followed by the present sell-off, XRP might attempt to secure gains. The Awesome Oscillator depicts price momentum and also accounts for reversals, the indicator displayed green signal bars.
These green signal bars were buy signals for the coin. Parabolic SAR also reads the price trend and changes in the same. Dotted lines were spotted below the candlestick which meant that XRP might turn positive over the next trading sessions.
Featured image from UnSplash, chart from TradingView.com
Tags: price analysisxrp

You can get bonuses upto $100 FREE BONUS when you:
💰 Install these recommended apps:
💲 SocialGood - 100% Crypto Back on Everyday Shopping
💲 xPortal - The DeFi For The Next Billion
💲 CryptoTab Browser - Lightweight, fast, and ready to mine!
💰 Register on these recommended exchanges:
🟡 Binance🟡 Bitfinex🟡 Bitmart🟡 Bittrex🟡 Bitget
🟡 CoinEx🟡 Crypto.com🟡 Gate.io🟡 Huobi🟡 Kucoin.





Comments