
The odds of a June rate cut have dropped sharply in the past week, raising downside prospects for riskier assets like XRP.
The XRP (XRP) market is flashing warning signs as a bearish technical pattern emerges on its weekly chart, coinciding with macroeconomic pressures from anticipated US tariffs in April.
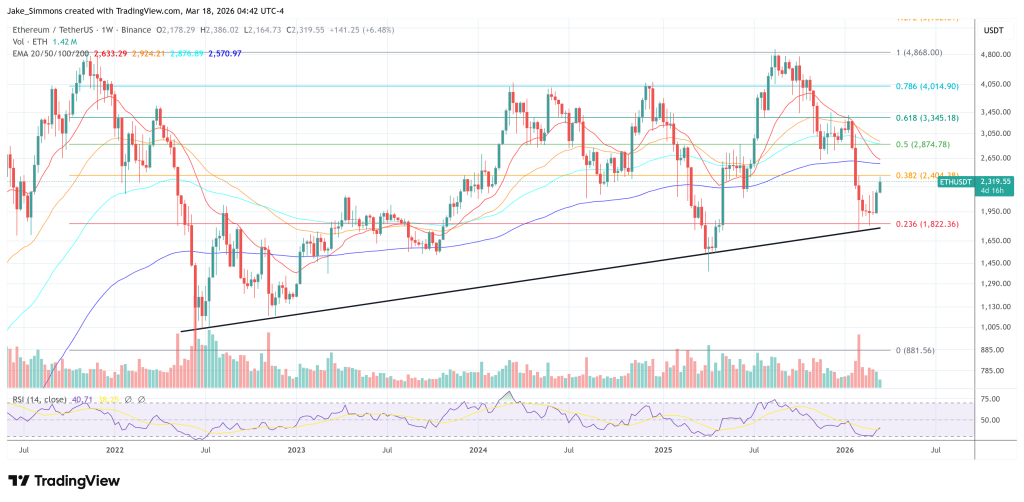
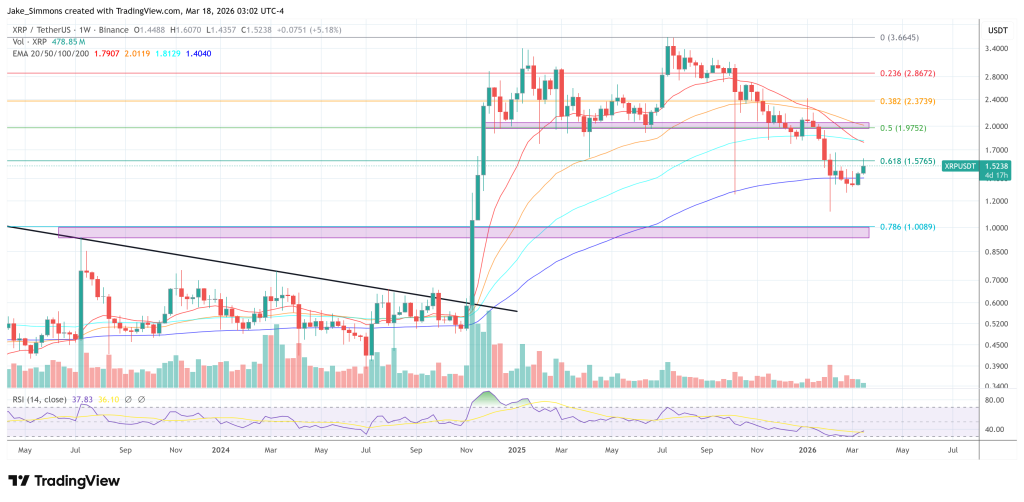
Since its late 2024 rally, the XRP price chart has been forming a potential triangle pattern on its weekly chart, characterized by a flat support level mixed with a downward-sloping resistance line.
A descending triangle pattern forming after a strong uptrend is seen as a bearish reversal indicator. As a rule, the setup resolves when the price breaks below the flat support level and falls by as much as the triangle’s maximum height.

You can get bonuses upto $100 FREE BONUS when you:
💰 Install these recommended apps:
💲 SocialGood - 100% Crypto Back on Everyday Shopping
💲 xPortal - The DeFi For The Next Billion
💲 CryptoTab Browser - Lightweight, fast, and ready to mine!
💰 Register on these recommended exchanges:
🟡 Binance🟡 Bitfinex🟡 Bitmart🟡 Bittrex🟡 Bitget
🟡 CoinEx🟡 Crypto.com🟡 Gate.io🟡 Huobi🟡 Kucoin.


Comments