
Bitcoin shorts start to suffer thanks to a $1,000 BTC price relief rally, but key resistance remains in place.
Bitcoin (BTC) rebounded off three-month lows on Sept. 12 as traders voiced suspicion over BTC price behavior.

Bitcoin shorts feel heat as BTC price adds $1,000
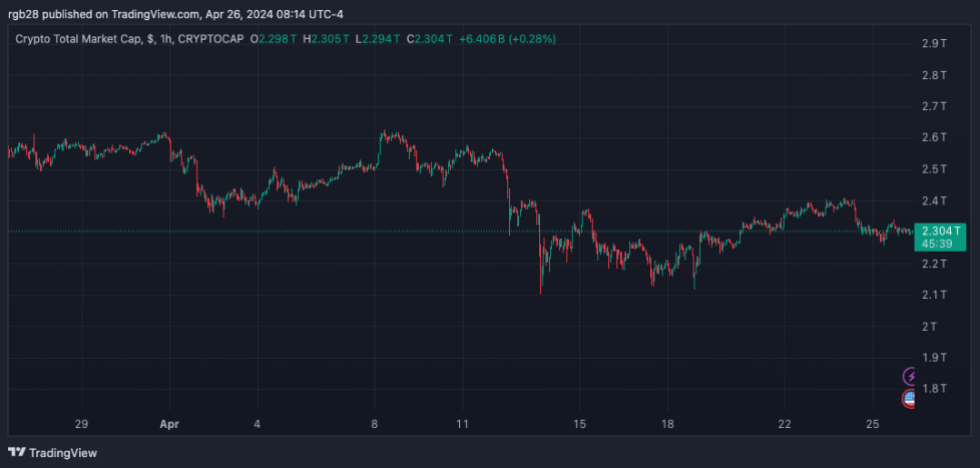
Data from Cointelegraph Markets Pro and TradingView followed a snap return to levels seen after the weekly close on BTC/USD.
Bitcoin had seen immediate weakness on the previous day’s Wall Street open, briefly dipping below $25,000 to cap its worst performance since mid-June.
The subsequent comeback took the largest cryptocurrency $1,000 higher, but at the time of writing, $26,000 still acted as resistance.
Ahead of time, on-chain monitoring resource Material Indicators warned that BTC price would soon face a “support test” thanks to bid liquidity further down the order book being removed.
#FireCharts shows 2 large #BTC Buy Walls have been rugged. Support test is inbound. pic.twitter.com/QnKIEoAnEc
— Material Indicators (@MI_Algos) September 11, 2023
In further preemptive analysis, Material Indicators and others noted that previous support “rug pulls” had ultimately produced Bitcoin market upside instead, with large-volume traders clearing liquidity from immediately around spot price.
Continuing, co-founder Keith Alan predicted that $24,750 would hold as support on the down move, something which at the time of writing holds true.
After the recovery, which he called a “textbook short squeeze,” popular trader Skew was among those calling for bulls to overcome $26,000 resistance.
$BTC CVDs & Price
— Skew Δ (@52kskew) September 12, 2023
Very clean perp CVD divergence with sellers failing to break below $25K
Setup criteria
> high short float in OI & negative funding
> Price reclaiming price level / failing to sustain LTF trend lower (Looks like SFP below initial low)
> Perp CVD divergence… pic.twitter.com/rsRLzAUbkE
“$25.6K - $25.3K still important for structure & confirmation of buyers,” Skew added.
Data from monitoring resource CoinGlass showed total BTC short liquidations at just over $12 million for Sept. 12 so far, while $71 million in BTC longs suffered the day prior.

Bitcoin price: "Next impulse" incoming?
Optimistic as ever, meanwhile, fellow popular trader Credible Crypto eyed a Bitcoin market cap dominance breakout as a potential precursor to the next bullish BTC price move.
Related: Double top ‘likely’ confirmed — 5 things to know in Bitcoin this week
In a fresh X analysis on Sept. 12, he flagged a local dominance downtrend being tested — something that last occurred in mid-June and sparked over $7,000 in gains over two weeks.
“Five days after BTC dominance broke its local downtrend, price followed suit with the next impulsive leg which was a $7,000 move,” part of accompanying comments read.
“With bullish market structure intact on BTC, 24.8k held, and BTC dominance breaking out, I think there is a decent argument to be made that our next impulse is just around the corner.”

Collect this article as an NFT to preserve this moment in history and show your support for independent journalism in the crypto space.
This article does not contain investment advice or recommendations. Every investment and trading move involves risk, and readers should conduct their own research when making a decision.

You can get bonuses upto $100 FREE BONUS when you:
💰 Install these recommended apps:
💲 SocialGood - 100% Crypto Back on Everyday Shopping
💲 xPortal - The DeFi For The Next Billion
💲 CryptoTab Browser - Lightweight, fast, and ready to mine!
💰 Register on these recommended exchanges:
🟡 Binance🟡 Bitfinex🟡 Bitmart🟡 Bittrex🟡 Bitget
🟡 CoinEx🟡 Crypto.com🟡 Gate.io🟡 Huobi🟡 Kucoin.


Comments