Bitcoin price dived below $30,000 before it started a major recovery against the US Dollar. BTC is back above $32,000, but it must clear the 100 hourly SMA for more gains.
- Bitcoin extended its decline below the $30,000 support zone before it started an upside correction.
- The price is now trading close to the $34,000 zone and the 100 hourly simple moving average.
- There is a major bearish trend line forming with resistance near $35,000 on the hourly chart of the BTC/USD pair (data feed from Kraken).
- The pair must clear the 100 hourly SMA and $35,000 to move into a bullish zone in the near term.
Bitcoin Price Starts Recovery
Bitcoin struggled to stay above the $32,000 support and it extended its decline. BTC broke the main $30,500 and $30,000 support levels to move further into a bearish zone.
The price even spiked below the $29,000 level and settled well below the 100 hourly simple moving average. It traded as low as $28,822 and it recently started an upside correction. Bitcoin gained pace and it was able to reclaim the $30,000 barrier.
There was also a break above the 50% Fib retracement level of the recent decline from the $36,171 swing high to $28,822 low. It is now trading close to the $34,000 zone and the 100 hourly simple moving average.
An initial resistance on the upside is near the $34,500 level. It is near the 76.4% Fib retracement level of the recent decline from the $36,171 swing high to $28,822 low. The main resistance is still near the $35,000 zone. There is also a major bearish trend line forming with resistance near $35,000 on the hourly chart of the BTC/USD pair.
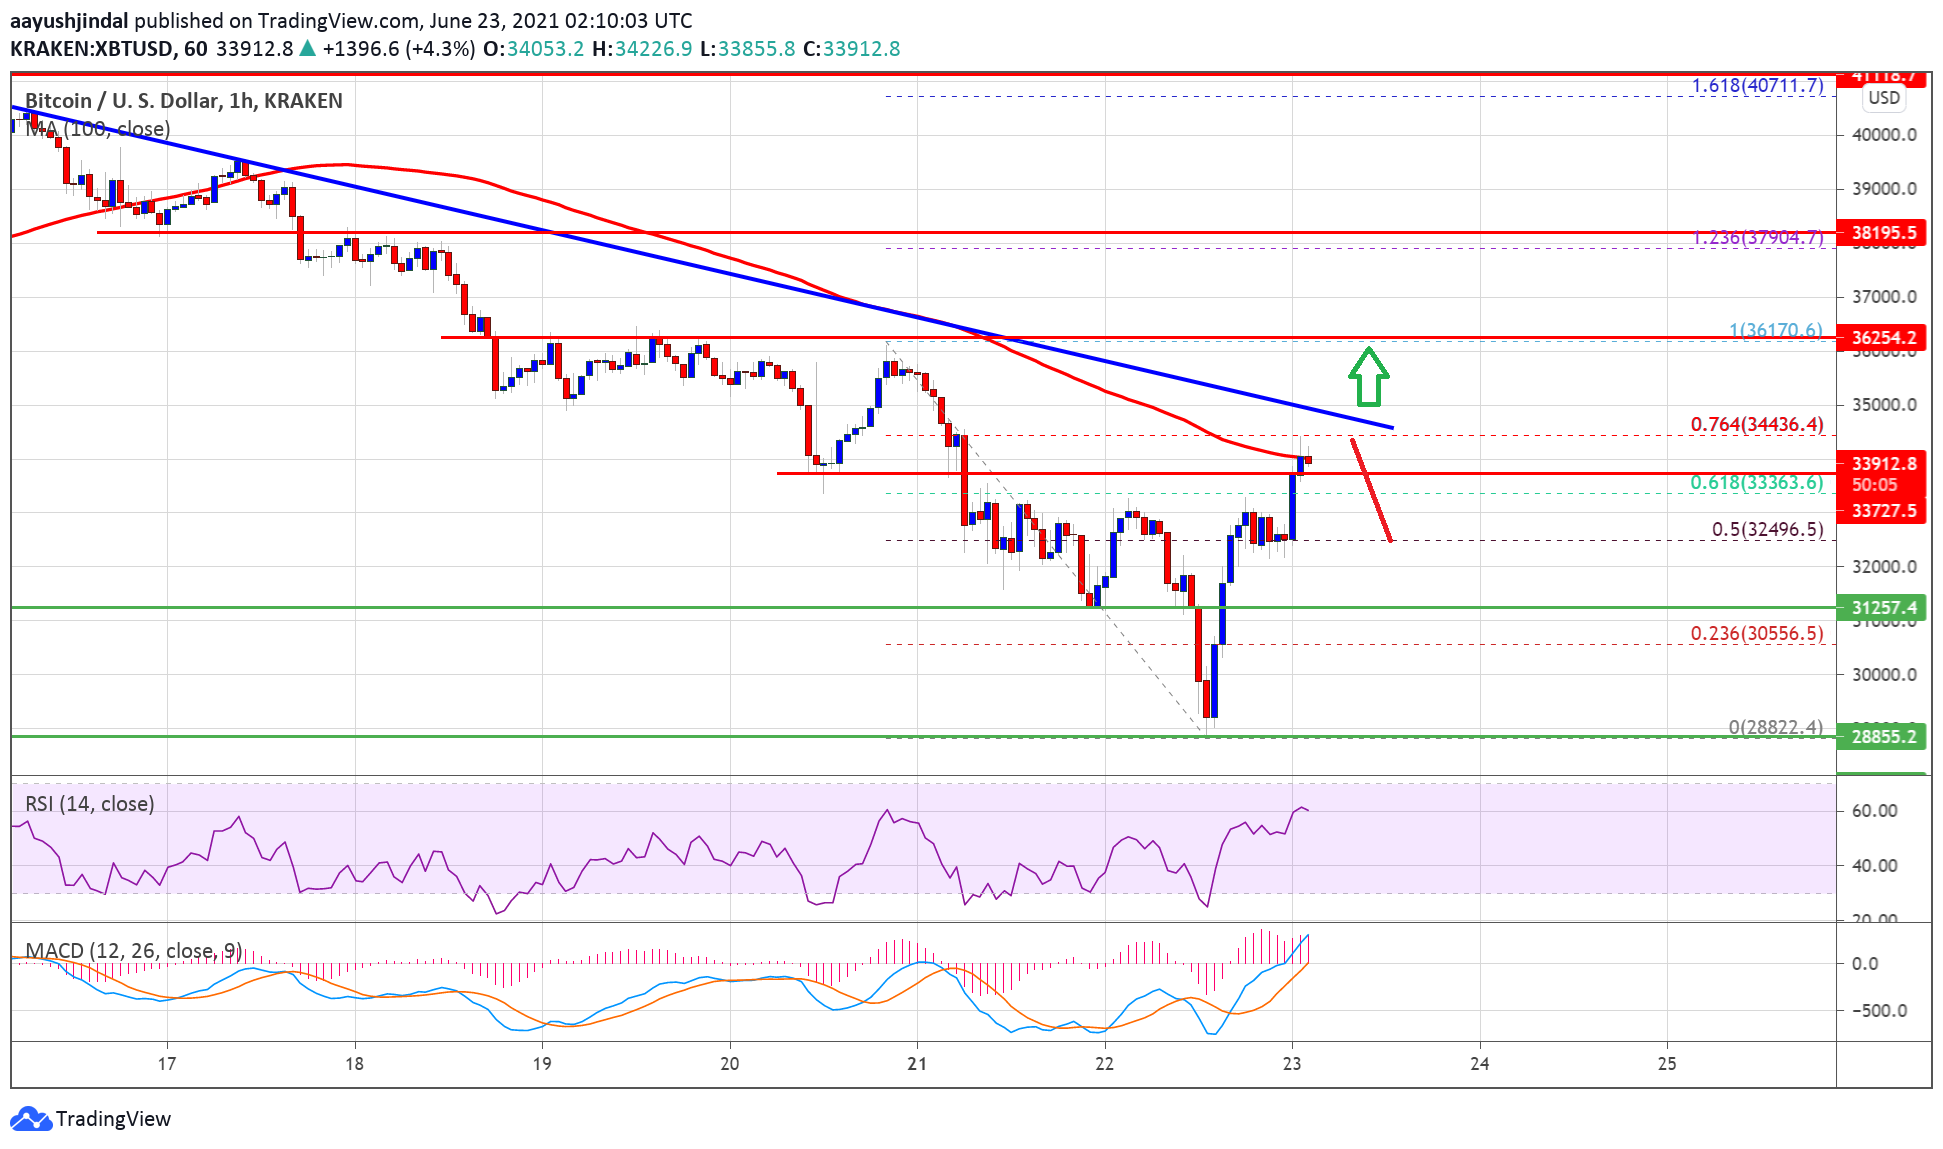
Source: BTCUSD on TradingView.com
Bitcoin must clear the 100 hourly SMA and then gain pace for a break above the $35,000 barrier to move into a positive zone.
Fresh Decline in BTC?
If bitcoin fails to clear the $34,500 resistance or the trend line resistance, it could start a fresh decline. An immediate support on the downside is near the $33,000 level.
The next major support is near the $32,500 level. A downside break below $32,500 could open the doors for a fresh drop towards the $30,000 zone in the coming sessions.
Technical indicators:
Hourly MACD &- The MACD is now moving into the bullish zone.
Hourly RSI (Relative Strength Index) &- The RSI for BTC/USD is back above the 50 level.
Major Support Levels &- $33,000, followed by $32,500.
Major Resistance Levels &- $34,500, $35,000 and $36,500.

You can get bonuses upto $100 FREE BONUS when you:
💰 Install these recommended apps:
💲 SocialGood - 100% Crypto Back on Everyday Shopping
💲 xPortal - The DeFi For The Next Billion
💲 CryptoTab Browser - Lightweight, fast, and ready to mine!
💰 Register on these recommended exchanges:
🟡 Binance🟡 Bitfinex🟡 Bitmart🟡 Bittrex🟡 Bitget
🟡 CoinEx🟡 Crypto.com🟡 Gate.io🟡 Huobi🟡 Kucoin.


Comments