Ethereum failed to continue above $2,500 and started a fresh decline against the US Dollar. ETH price is showing bearish signs and it could continue lower below $2,240.
- Ethereum is struggling to gain bullish momentum above the $2,400 and $2,500 levels.
- The price is now trading well below $2,450 and the 100 hourly simple moving average.
- There is a key bearish trend line forming with resistance near $2,410 on the hourly chart of ETH/USD (data feed via Kraken).
- The pair could accelerate lower if it breaks the $2,200 support zone in the near term.
Ethereum Price Is Showing Bearish Signs
Ethereum started a decent recovery from the $2,200 support zone. ETH climbed above the $2,300 and $2,350 resistance levels. However, the bulls failed to gain strength for a push above $2,450 and the 100 hourly simple moving average.
The price started a fresh decline and traded below the $2,400 level. It broke the 50% Fib retracement level of the upward move from the $2,200 swing low to $2,481 high.
It is now trading well below $2,450 and the 100 hourly simple moving average. There is also a key bearish trend line forming with resistance near $2,410 on the hourly chart of ETH/USD. Ether is now testing the 61.8% Fib retracement level of the upward move from the $2,200 swing low to $2,481 high.
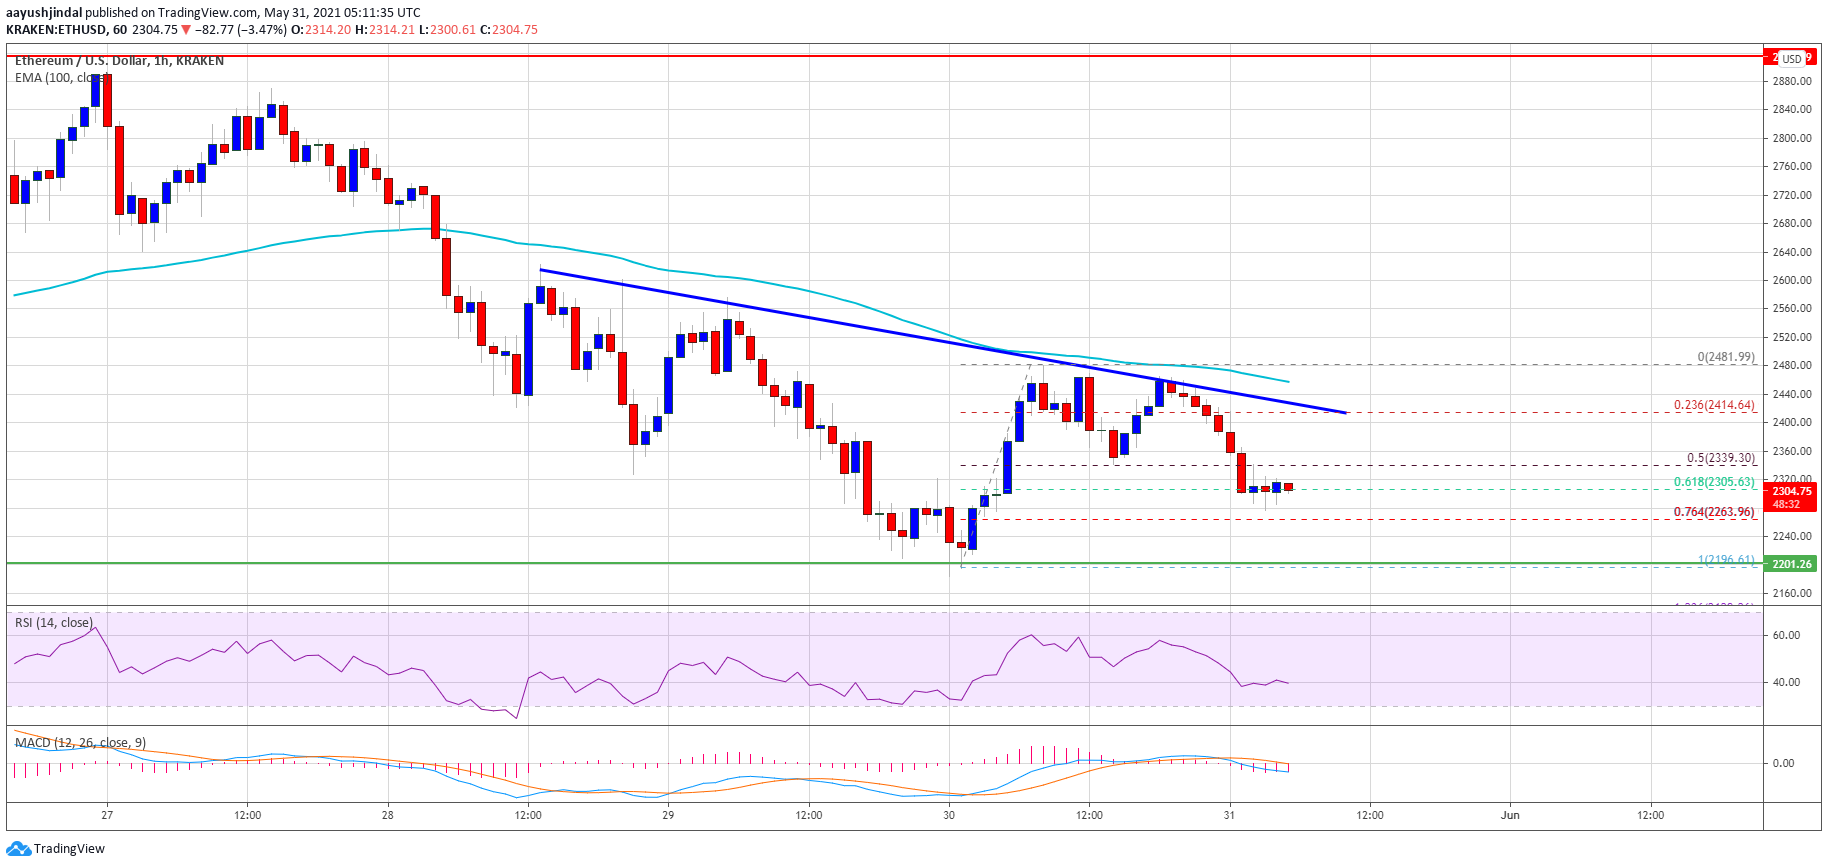
Source: ETHUSD on TradingView.com
On the upside, an immediate resistance is near the $2,360 level. The first major resistance is near the trend line and the $2,440 level. A close above the trend line could start a major increase towards the $2,500 level. The next major resistance is near the $2,550 level.
More Losses in ETH?
If Ethereum fails to clear the $2,400 and $2,450 resistance levels, it could extend its decline. An initial support on the downside is near the $2,250 zone.
The first major support is now near the $2,200 level. A downside break below the $2,200 support might spark a larger decline. The next key support is near the $2,200 level. Any more losses could lead the price towards the $1,850 support zone, followed by the $1,700 region.
Technical Indicators
Hourly MACD &- The MACD for ETH/USD is slowly losing pace in the bearish zone.
Hourly RSI &- The RSI for ETH/USD is currently below the 50 level.
Major Support Level &- $2,200
Major Resistance Level &- $2,450

You can get bonuses upto $100 FREE BONUS when you:
💰 Install these recommended apps:
💲 SocialGood - 100% Crypto Back on Everyday Shopping
💲 xPortal - The DeFi For The Next Billion
💲 CryptoTab Browser - Lightweight, fast, and ready to mine!
💰 Register on these recommended exchanges:
🟡 Binance🟡 Bitfinex🟡 Bitmart🟡 Bittrex🟡 Bitget
🟡 CoinEx🟡 Crypto.com🟡 Gate.io🟡 Huobi🟡 Kucoin.


Comments